Twin Axes & Secondary Y
Reviewed & published by Brayan K
Matplotlib is a Python library for creating charts and visualizations — and twin axes let you overlay two series with completely different scales, like temperature and rainfall, on a single shared x-axis.
Part of the free Matplotlib course at LearnCodingFast — hands-on lessons with worked examples and the output they print, plus practice exercises and a quick quiz.
In this lesson you'll create a second y-axis with ax.twinx(), color-code each axis to its line, and combine both series into one legend.
What You'll Learn in This Lesson
- Why two series may need separate y-scales
- Creating a secondary y-axis with ax.twinx()
- Plotting on the left and right axes
- Color-matching each axis to its line
- Labelling both y-axes clearly
- Combining two series into one legend
1 Why You Need a Second Y-Axis
Imagine plotting temperature (around 20°C) and rainfall (around 200 mm) on the same y-axis. The rainfall values are ten times bigger, so the temperature line would be squashed flat at the bottom. A twin axis gives each series its own scale.
import matplotlib.pyplot as plt

months = ['Jan', 'Feb', 'Mar', 'Apr', 'May']
temp = [5, 7, 11, 16, 20]        # degrees Celsius
rain = [80, 70, 90, 60, 50]      # millimetres

fig, ax = plt.subplots()

# Left axis: temperature
ax.plot(months, temp, color='tab:red', marker='o')

# Create a twin sharing the same x-axis
ax2 = ax.twinx()

# Right axis: rainfall
ax2.plot(months, rain, color='tab:blue', marker='s')

plt.title("Temperature and rainfall")
plt.show()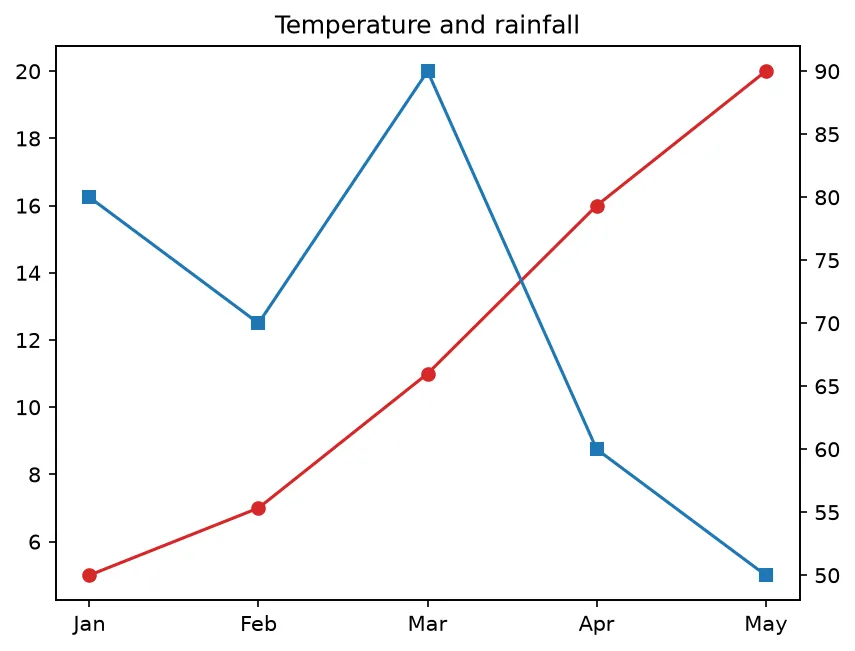
What you'll see: two lines over the same months — a red temperature line rising left-to-right, and a blue rainfall line, each read against its own y-axis (temperature on the left, rainfall on the right).
2 Color-Coding the Axes
With two y-axes, the reader needs to know which scale belongs to which line. The convention is to color each set_ylabel to match its line — and color the tick labels too with ax.tick_params(axis='y', labelcolor=...).
import matplotlib.pyplot as plt

months = ['Jan', 'Feb', 'Mar', 'Apr', 'May']
temp = [5, 7, 11, 16, 20]
rain = [80, 70, 90, 60, 50]

fig, ax = plt.subplots()

# Temperature on the left, in red
ax.plot(months, temp, color='tab:red', marker='o')
ax.set_ylabel("Temperature (°C)", color='tab:red')
ax.tick_params(axis='y', labelcolor='tab:red')

# Rainfall on the right twin, in blue
ax2 = ax.twinx()
ax2.plot(months, rain, color='tab:blue', marker='s')
ax2.set_ylabel("Rainfall (mm)", color='tab:blue')
ax2.tick_params(axis='y', labelcolor='tab:blue')

ax.set_xlabel("Month")
plt.title("Color-coded twin axes")
plt.show()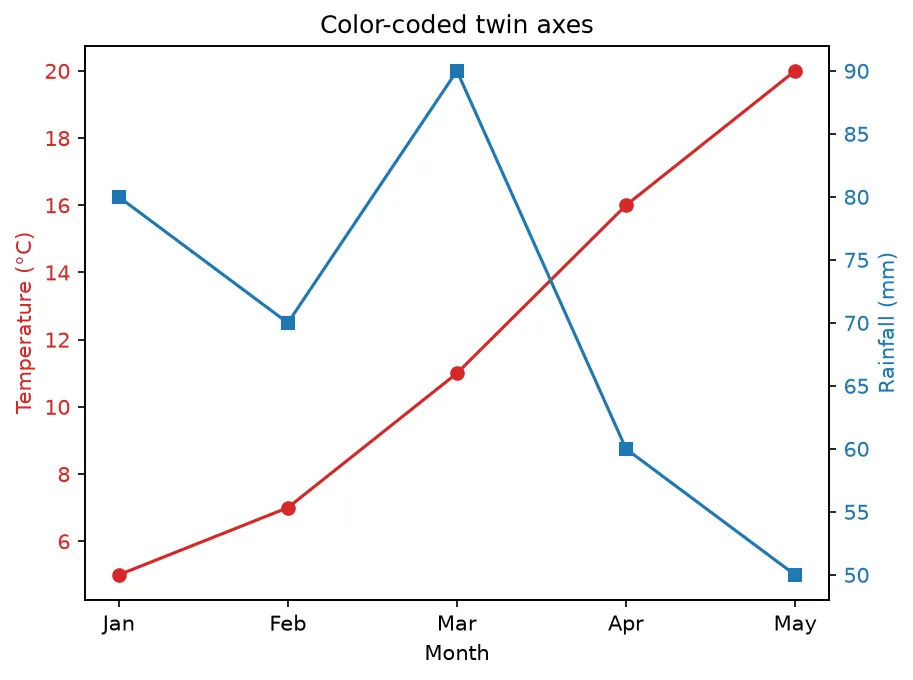
What you'll see: the same two-line chart, but now the left axis label and ticks are red (matching the temperature line) and the right axis label and ticks are blue (matching rainfall) — so it's obvious which scale each line uses.
3 Combining Both Lines in One Legend
Because each line lives on a different axes, a normal ax.legend() would only show one of them. The fix: keep the line objects that plot() returns, then build a single legend from both.
import matplotlib.pyplot as plt

months = ['Jan', 'Feb', 'Mar', 'Apr', 'May']
temp = [5, 7, 11, 16, 20]
rain = [80, 70, 90, 60, 50]

fig, ax = plt.subplots()
ax2 = ax.twinx()

# Keep the line objects (note the trailing comma to unpack)
line1, = ax.plot(months, temp, color='tab:red', marker='o', label='Temp (°C)')
line2, = ax2.plot(months, rain, color='tab:blue', marker='s', label='Rain (mm)')

ax.set_ylabel("Temperature (°C)")
ax2.set_ylabel("Rainfall (mm)")

# One combined legend built from both lines
ax.legend([line1, line2], ['Temp (°C)', 'Rain (mm)'], loc='upper left')

plt.title("Twin axes with a shared legend")
plt.show()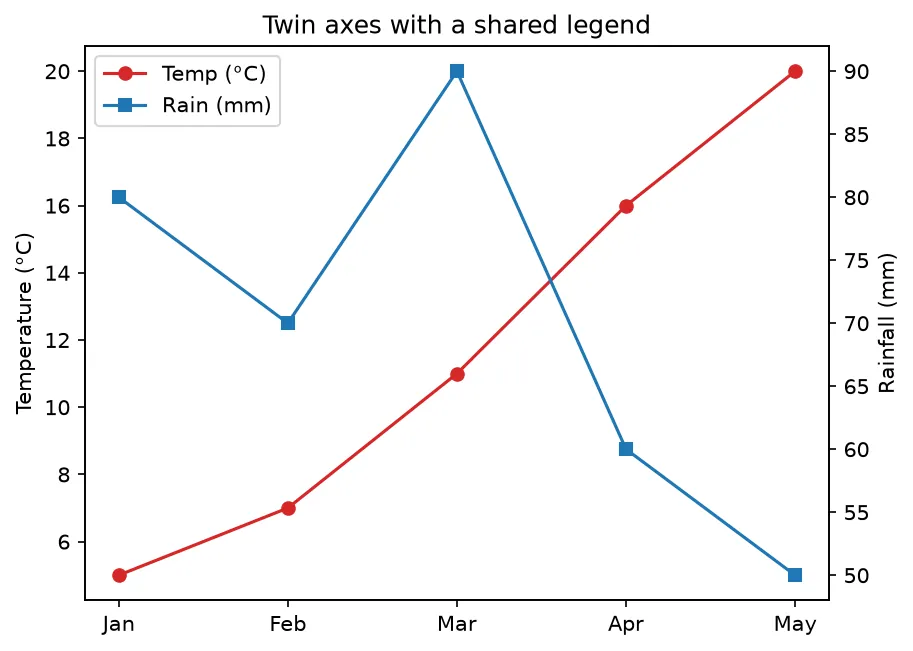
What you'll see: the dual-scale chart with a single legend box in the upper-left listing both "Temp (°C)" and "Rain (mm)" together — even though the two lines belong to different axes.
🎯 Your Turn: Fill in the Blanks
Replace each ___ to add a second y-axis and label it.
import matplotlib.pyplot as plt

months = ['Jan', 'Feb', 'Mar', 'Apr']
sales = [100, 130, 120, 160]
returns = [5, 8, 6, 9]

fig, ax = plt.subplots()
ax.plot(months, sales, color='tab:green')
ax.set_ylabel("Sales", color='tab:green')

# Create the second y-axis sharing the x-axis
ax2 = ax.___()

ax2.plot(months, returns, color='tab:orange')
ax2.set_ylabel("Returns", color='tab:orange')

plt.___()
📋 Common Errors & Quick Reference
❌ One line is squashed flat at the bottom
The two series share a single y-axis. Add ax2 = ax.twinx() and plot the second series on ax2.
❌ My legend only shows one line
Each axes has its own legend. Keep both line objects and call ax.legend([line1, line2], [...]).
| Call | What It Does |
|---|---|
| ax2 = ax.twinx() | Add a second y-axis (shared x) |
| ax.set_ylabel("L", color=...) | Color a y-axis label |
| ax.tick_params(axis='y', labelcolor=...) | Color the y-tick labels |
| ax.legend([l1, l2], [...]) | One legend for both lines |
🏆 Mini Challenge: Price vs Volume
Plot a stock's price and trading volume on twin axes with matching colors and a shared legend.
import matplotlib.pyplot as plt

days = [1, 2, 3, 4, 5]
price = [150, 153, 149, 158, 161]      # dollars
volume = [1200, 1800, 900, 2200, 1600] # shares

fig, ax = plt.subplots()
ax2 = ax.twinx()

# 1. Price on the left axis (purple)
line1, = ax.plot(days, price, color='tab:purple', marker='o', label='Price ($)')
ax.set_ylabel("Price ($)", color='tab:purple')
ax.tick_params(axis='y', labelcolor='tab:purple')

# 2. Volume on the right axis (gray)
line2, = ax2.plot(days, volume, color='tab:gray', marker='s', label='Volume')
ax2.set_ylabel("Volume", color='tab:gray')
ax2.tick_params(axis='y', labelcolor='tab:gray')

# 3. One combined legend
ax.legend([line1, line2], ['Price ($)', 'Volume'], loc='upper left')

ax.set_xlabel("Day")
plt.title("Price vs trading volume")
plt.show()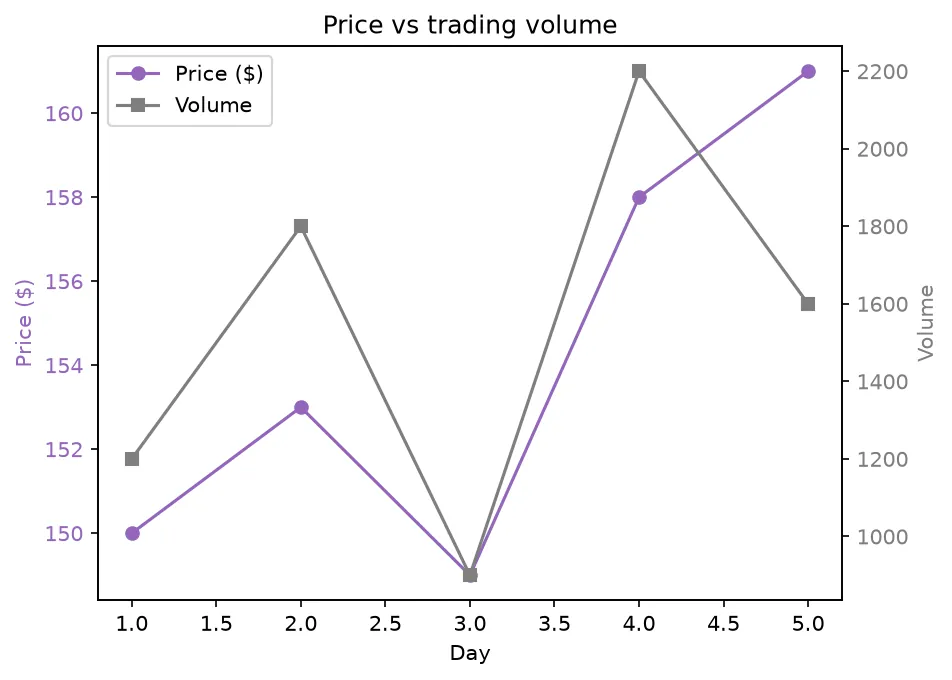
import matplotlib.pyplot as plt

months = [1, 2, 3, 4]
sales = [100, 140, 120, 180]
temp = [4.0, 6.5, 9.0, 13.5]

fig, ax = plt.subplots()
ax.bar(months, sales, color="steelblue")
ax.set_ylabel("sales")

ax2 = ax.twinx()
ax2.plot(months, temp, color="tomato", marker="o")
ax2.set_ylabel("temperature")

print("Axes on the figure:", len(fig.axes))
print("They share the x axis:", ax.get_shared_x_axes().joined(ax, ax2))
print("Left label: ", ax.get_ylabel())
print("Right label:", ax2.get_ylabel())
print("Different y ranges:", ax.get_ylim() != ax2.get_ylim())
print("Bars on the left, a line on the right:", len(ax.patches), len(ax2.lines))

# ✅ Expected output:
# Axes on the figure: 2
# They share the x axis: True
# Left label:  sales
# Right label: temperature
# Different y ranges: True
# Bars on the left, a line on the right: 4 1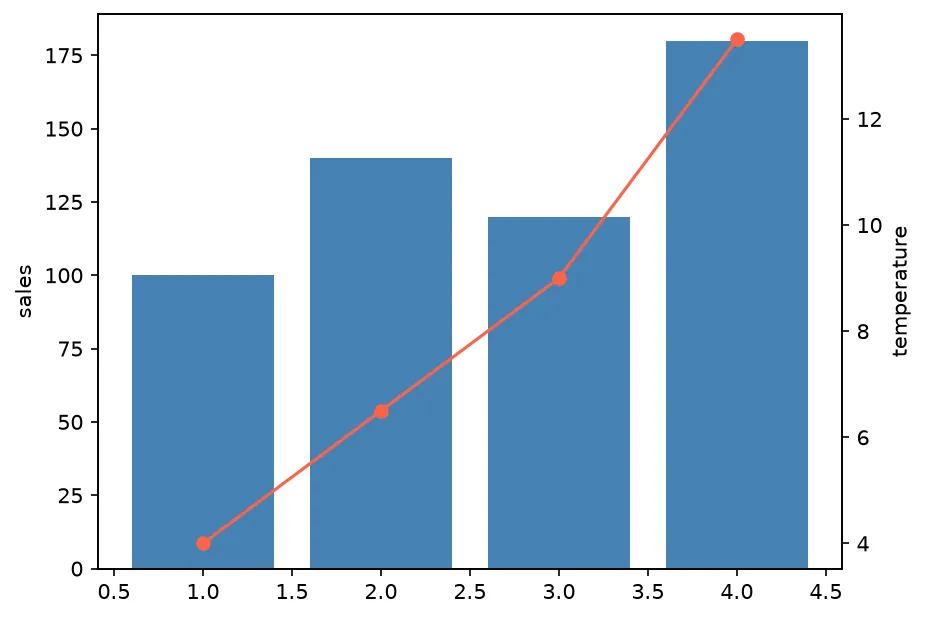
❓ Frequently Asked Questions
Lesson complete — two scales, one chart!
You created a secondary y-axis with ax.twinx(), color-matched each axis to its line, and merged two series into a single shared legend.
Practice quiz
What is a twin axis?
- A second figure window
- A duplicated chart title
- A second y-axis that shares the same x-axis
- Two separate subplots side by side
Answer: A second y-axis that shares the same x-axis. A twin axis is a second y-axis sharing the same x-axis, made with ax.twinx().
Which call creates a second y-axis sharing the x-axis?
- ax2 = ax.twinx()
- ax2 = ax.copy()
- ax2 = plt.second_axis()
- ax2 = ax.clone()
Answer: ax2 = ax.twinx(). ax2 = ax.twinx() makes a new axes with an independent y-axis on the right.
When is a twin axis most useful?
- When both series use the same units
- When you have only one series
- When you want a 3D chart
- When two series share x but have very different scales
Answer: When two series share x but have very different scales. It gives each series its own y-scale so one isn't squashed flat.
How do you color a y-axis label to match its line?
- ax.color_label('red')
- ax.set_ylabel('Temp', color='tab:red')
- ax.label_color('red')
- ax.ylabel('Temp').color('red')
Answer: ax.set_ylabel('Temp', color='tab:red'). set_ylabel('Temp', color='tab:red') colors the label to match the line.
Which call colors the y-tick labels of an axis?
- ax.set_tickcolor('red')
- ax.color_ticks('red')
- ax.tick_params(axis='y', labelcolor='tab:red')
- ax.yticks(color='red')
Answer: ax.tick_params(axis='y', labelcolor='tab:red'). tick_params(axis='y', labelcolor=...) recolors the y-tick labels.
Why does a plain ax.legend() show only one line on twin axes?
- Each axes has its own separate lines
- Legends are disabled on twins
- twinx() deletes labels
- Only the last line is kept
Answer: Each axes has its own separate lines. Each line lives on a different axes, so one axes' legend sees only its own lines.
What does the trailing comma do in 'line1, = ax.plot(...)'?
- Adds a second line
- Sets the line color
- Reverses the data
- Unpacks the single Line2D from the returned list
Answer: Unpacks the single Line2D from the returned list. plot() returns a list; the trailing comma unpacks the single Line2D object.
How do you build one legend covering both lines?
- Call ax.legend() twice
- ax.legend([line1, line2], ['A', 'B'])
- plt.legend('all')
- ax2.legend(ax)
Answer: ax.legend([line1, line2], ['A', 'B']). Gather the saved line objects and pass them both to ax.legend([...], [...]).
What problem does twinx() solve when units differ greatly?
- It changes the x-axis labels
- It adds gridlines
- One series being squashed flat against a single shared y-axis
- It rotates the chart
Answer: One series being squashed flat against a single shared y-axis. Without a twin, the smaller-scale series flattens; the twin gives it its own scale.
On which side does ax.twinx() place the new y-axis?
- The right side of the chart
- The left side
- The top
- The bottom
Answer: The right side of the chart. twinx() adds an independent y-axis on the right while sharing the x-axis.
Continue this course
- Previous: Plotting with Dates
- Next: Plotting with Pandas — Chart DataFrames directly using the pandas .plot() interface
- Quick reference: Matplotlib cheat sheet
Frequently asked questions
What is a twin axis?
A twin axis is a second y-axis that shares the same x-axis. You create it with ax2 = ax.twinx(), which lets you plot two series with very different scales — like temperature and rainfall — on one chart.
When should I use ax.twinx()?
Use it when two series share an x-axis but have different units or ranges, so plotting them on a single y-axis would flatten one of them. The twin gives each series its own y-scale.
How do I tell which line belongs to which axis?
Color is the standard trick: set each line and its matching y-label to the same color with ax.set_ylabel('Temp', color='tab:red') and the same color on the line. The reader follows the color.
How do I make one combined legend?
Each axis has its own lines, so gather them together: keep the Line2D objects returned by plot(), then call ax.legend([line1, line2], ['A', 'B']) to put both in a single legend box.