Plotting with Pandas
Reviewed & published by Brayan K
Matplotlib is a Python library for creating charts and visualizations — and pandas plugs straight into it, so you can chart a whole DataFrame with a single .plot() call.
Part of the free Matplotlib course at LearnCodingFast — hands-on lessons with worked examples and the output they print, plus practice exercises and a quick quiz.
In this lesson you'll learn how pandas wraps Matplotlib, turning columns of data into line and bar charts and then styling them with the familiar pyplot tools.
What You'll Learn in This Lesson
- How pandas .plot() uses Matplotlib under the hood
- Plotting every column of a DataFrame at once
- Drawing bar charts with kind='bar'
- Plotting a single Series with df['col'].plot()
- Choosing x and y columns explicitly
- Styling the returned Axes with set_title and legend
1 Pandas Plots Are Matplotlib Plots
pandas ships with a .plot() method on both DataFrames and Series. Behind the scenes it calls Matplotlib for you, so a single line draws an entire table of data.
📊 Why use pandas plotting?
- Each column becomes its own line automatically
- The DataFrame index becomes the x-axis
- A legend is generated from the column names
- You still get a Matplotlib Axes back to customize
Build a small DataFrame and plot every column at once:
import pandas as pd
import matplotlib.pyplot as plt

# A small table: monthly sales for two stores
data = {
    "North": [100, 140, 120, 200, 240],
    "South": [80, 110, 160, 150, 210],
}
df = pd.DataFrame(data, index=["Jan", "Feb", "Mar", "Apr", "May"])

# One call plots BOTH columns as lines
df.plot()

plt.title("Monthly Sales by Store")
plt.show()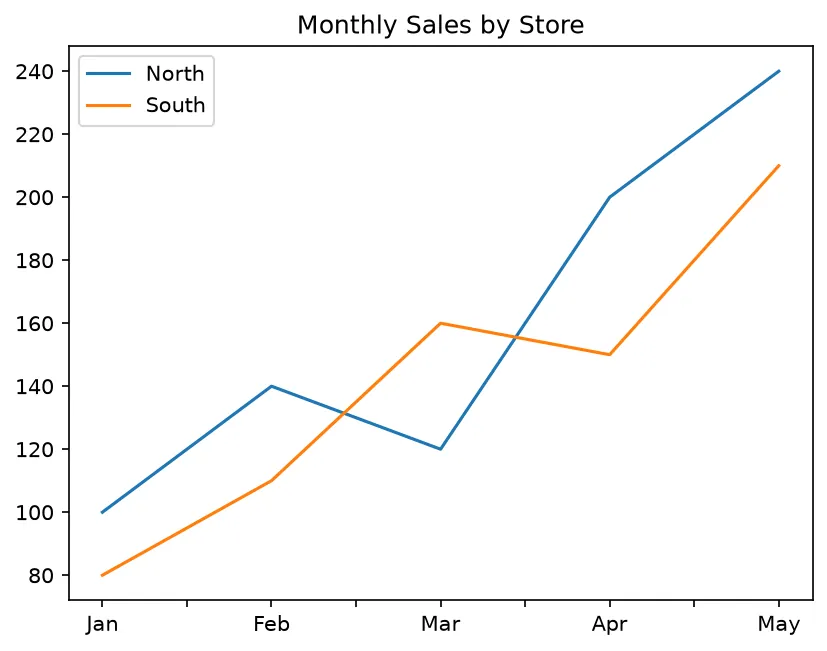
What you'll see: a chart with two lines — one for "North" and one for "South" — sharing the same month labels along the bottom. Pandas read the column names to build the legend in the corner, and the DataFrame index (Jan–May) became the x-axis automatically.
2 Bar Charts and Single Columns
Pass kind='bar' to draw bars instead of lines, and use df['col'] to plot just one column as a Series.
import pandas as pd
import matplotlib.pyplot as plt

data = {
    "North": [100, 140, 120, 200, 240],
    "South": [80, 110, 160, 150, 210],
}
df = pd.DataFrame(data, index=["Jan", "Feb", "Mar", "Apr", "May"])

# Grouped bar chart for both columns
df.plot(kind="bar")
plt.title("Sales Comparison")

# Plot just ONE column as a Series
df["North"].plot(kind="line", legend=True)

plt.show()![The chart this code draws: Use kind='bar' and df['col'].plot()](/charts/plot-with-pandas-2.webp)
What you'll see: a grouped bar chart with a North bar and a South bar standing side by side for each month. Selecting a single column with df["North"] gives you a Series, whose .plot() draws only that one set of values.
3 Choosing x, y and Styling the Axes
When your data lives in ordinary columns rather than the index, name them explicitly with x= and y=. The .plot() call returns a Matplotlib Axes you can style.
import pandas as pd
import matplotlib.pyplot as plt

df = pd.DataFrame({
    "month": [1, 2, 3, 4, 5],
    "revenue": [100, 140, 120, 200, 240],
})

# Pick which columns are x and y
ax = df.plot(x="month", y="revenue", marker="o")

# ax is a Matplotlib Axes — style it like normal
ax.set_title("Revenue Over Time")
ax.set_xlabel("Month")
ax.set_ylabel("Revenue (USD)")

plt.show()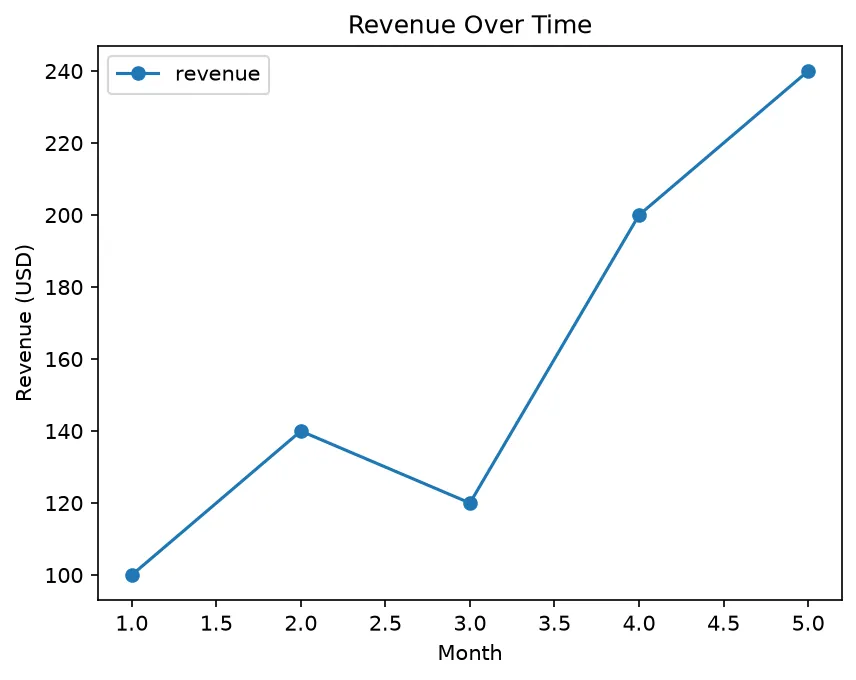
What you'll see: a single line rising from 100 to 240 with a circular marker at each point. Because you captured the return value in ax, you could add a title and axis labels using the same Axes methods you learned earlier in the course.
🎯 Your Turn: Fill in the Blanks
Replace each ___ to plot a DataFrame as a bar chart and show it.
import pandas as ___           # the standard alias
import matplotlib.pyplot as plt

df = pd.DataFrame({
    "fruit": ["apple", "banana", "cherry"],
    "count": [12, 7, 20],
})

# Plot count by fruit as a BAR chart
df.plot(x="fruit", y="count", kind="___")

# Display the chart
plt.___()
📋 Common Errors & Quick Reference
❌ ModuleNotFoundError: No module named 'pandas'
Install it first with pip install pandas. Matplotlib must also be installed.
The column name passed to x= or y= doesn't exist. Check spelling and capitalization against your DataFrame.
| Call | What It Does |
|---|---|
| df.plot() | Line plot of every column |
| df.plot(kind='bar') | Grouped bar chart |
| df['col'].plot() | Plot a single column |
| df.plot(x='a', y='b') | Choose x and y columns |
🏆 Mini Challenge: Weekly Temperatures
Build a DataFrame of two cities' temperatures, plot both lines, and add a title.
import pandas as pd
import matplotlib.pyplot as plt

df = pd.DataFrame({
    "London": [14, 16, 15, 19, 21, 20, 18],
    "Paris":  [16, 18, 17, 22, 24, 23, 21],
}, index=["Mon", "Tue", "Wed", "Thu", "Fri", "Sat", "Sun"])

# 1. Plot both columns as lines
ax = df.plot(marker="o")

# 2. Title the chart
ax.set_title("Weekly Temperatures")

# 3. Show it
plt.show()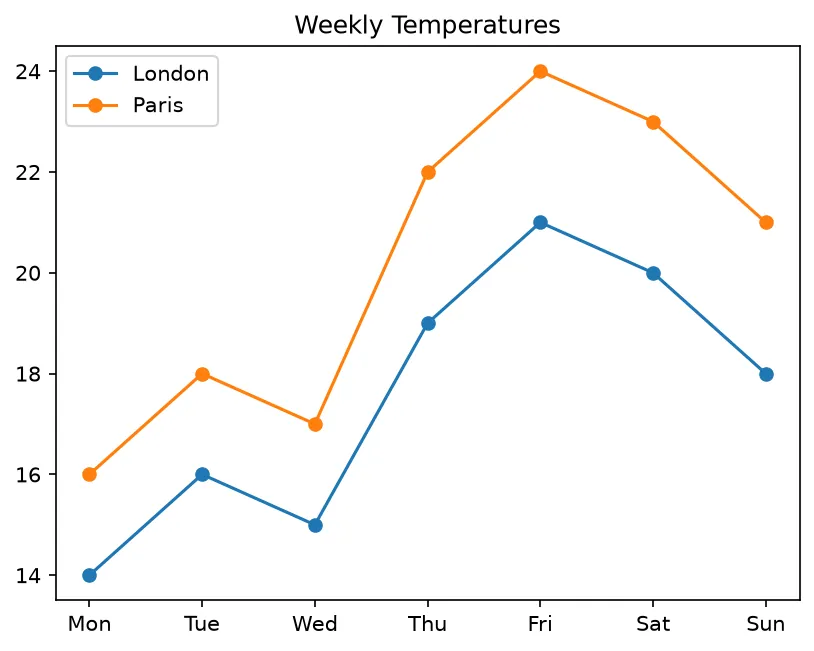
import pandas as pd
import matplotlib.pyplot as plt

df = pd.DataFrame(
    {"month": ["Jan", "Feb", "Mar"], "sales": [100, 140, 120], "returns": [5, 9, 7]}
).set_index("month")

ax = df.plot(kind="bar", figsize=(6, 4))
fig = ax.get_figure()

print("Columns plotted:", list(df.columns))
print("Bars:", len(ax.patches), "= rows x columns =", len(df), "x", len(df.columns))
print("Legend entries:", [t.get_text() for t in ax.get_legend().get_texts()])
print("X tick labels:", [t.get_text() for t in ax.get_xticklabels()])
print("Sales total:", int(df["sales"].sum()))
print("Best month:", df["sales"].idxmax())

# ✅ Expected output:
# Columns plotted: ['sales', 'returns']
# Bars: 6 = rows x columns = 3 x 2
# Legend entries: ['sales', 'returns']
# X tick labels: ['Jan', 'Feb', 'Mar']
# Sales total: 360
# Best month: Feb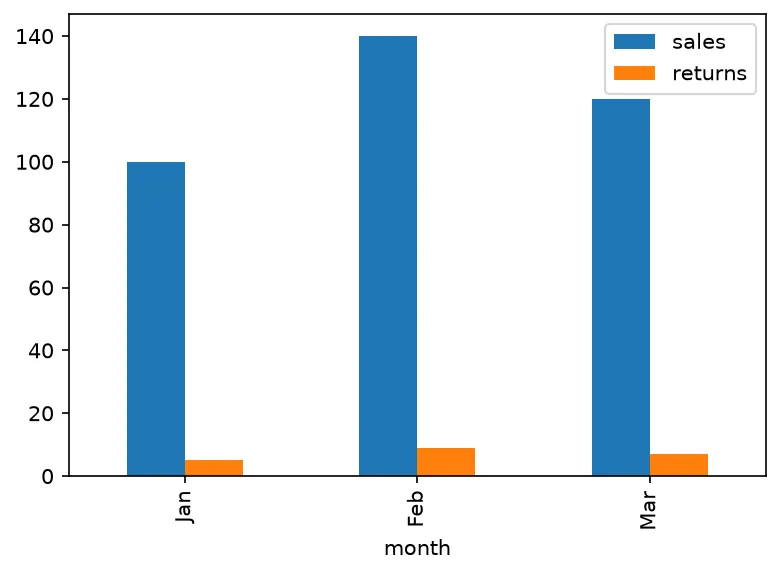
❓ Frequently Asked Questions
Lesson complete — you can chart a DataFrame in one line!
You learned that pandas .plot() wraps Matplotlib, drew lines and bars from columns, and styled the returned Axes just like a regular plot.
Practice quiz
Which library's plotting is df.plot() a thin wrapper around?
- Seaborn
- Matplotlib
- Plotly
- Bokeh
Answer: Matplotlib. pandas .plot() builds the figure using Matplotlib under the hood.
What object does df.plot() return?
- A Matplotlib Axes
- A DataFrame
- A Figure
- None
Answer: A Matplotlib Axes. It returns a Matplotlib Axes you can style with set_title, set_xlabel, etc.
Which argument draws bars instead of lines?
- type='bar'
- mode='bar'
- kind='bar'
- style='bar'
Answer: kind='bar'. df.plot(kind='bar') draws a bar chart; df.plot.bar() is equivalent.
What becomes the x-axis when you call df.plot() with no x argument?
- The first column
- The DataFrame index
- A range 0..n
- The last column
Answer: The DataFrame index. The DataFrame index is used as the x-axis automatically.
How do you plot a single column named 'North' as a Series?
- df.plot('North')
- df.column('North')
- df.North.col().plot()
- df['North'].plot()
Answer: df['North'].plot(). Selecting df['North'] gives a Series whose .plot() draws just that column.
How do you choose which columns are x and y explicitly?
- df.plot(x='month', y='revenue')
- df.plot(rows='month')
- df.plot(axis='month')
- df.plot(index='month')
Answer: df.plot(x='month', y='revenue'). Pass x= and y= to name the columns used for each axis.
What is df.plot.bar() equivalent to?
- df.plot(kind='barh')
- df.plot(kind='line')
- df.plot(kind='bar')
- df.bar()
Answer: df.plot(kind='bar'). df.plot.bar() and df.plot(kind='bar') do exactly the same thing.
After capturing ax = df.plot(), how do you set the title?
- ax.title('X')
- ax.add_title('X')
- df.title('X')
- ax.set_title('X')
Answer: ax.set_title('X'). ax is a Matplotlib Axes, so ax.set_title() works as usual.
What error means a column name passed to y= does not exist?
- KeyError
- ValueError
- TypeError
- IndexError
Answer: KeyError. A missing column name raises KeyError; check spelling and capitalization.
In a plain script, what still opens the chart window after df.plot()?
- df.render()
- plt.draw()
- plt.show()
- df.display()
Answer: plt.show(). Call plt.show() after df.plot() to display the chart in a script.
Continue this course
- Previous: Twin Axes & Secondary Y
- Next: Heatmaps & imshow — Visualize 2D grids and matrices with color and a colorbar
- Quick reference: Matplotlib cheat sheet
Frequently asked questions
Does pandas use Matplotlib for plotting?
Yes. The DataFrame.plot() and Series.plot() methods are thin wrappers around Matplotlib. Pandas builds the figure for you, so you can still use plt.title(), plt.show(), and savefig() exactly as you would with plain Matplotlib.
What does df.plot() return?
It returns a Matplotlib Axes object. You can capture it with ax = df.plot() and then call ax.set_title(), ax.set_xlabel(), or ax.legend() to customize the chart further.
How do I make a bar chart from a DataFrame?
Pass kind='bar' (or 'barh' for horizontal) to plot: df.plot(kind='bar'). You can also use df.plot.bar() — the two forms are equivalent.
Do I still need plt.show()?
In a plain script, yes — call plt.show() after df.plot() to open the window. In Jupyter notebooks the chart usually appears inline automatically.