Heatmaps & imshow
Reviewed & published by Brayan K
Matplotlib is a Python library for creating charts and visualizations — and with imshow() it can paint a 2D grid of numbers as a grid of colors called a heatmap.
Part of the free Matplotlib course at LearnCodingFast — hands-on lessons with worked examples and the output they print, plus practice exercises and a quick quiz.
In this lesson you'll turn arrays into heatmaps, add a colorbar legend, label the axes, and annotate each cell with its value.
What You'll Learn in This Lesson
- What a heatmap is and when to use one
- Drawing a 2D array with plt.imshow()
- Choosing colormaps with the cmap argument
- Adding a colorbar legend
- Labeling axes with custom tick labels
- Annotating each cell with plt.text()
1 Your First Heatmap with imshow
imshow ("image show") treats a 2D array like an image: each number becomes one colored square. A colorbar turns that color scale into a readable legend.
📊 When is a heatmap the right chart?
- Correlation matrices between variables
- Confusion matrices from machine learning
- Any grid where patterns matter more than exact numbers
- Data with two categorical axes and one value
Generate a small random grid and display it:
import numpy as np
import matplotlib.pyplot as plt

# A 5x5 grid of random values between 0 and 1
data = np.random.rand(5, 5)

# Paint the grid as colored squares
plt.imshow(data, cmap="viridis")

# Show what each color means
plt.colorbar()

plt.title("Random 5x5 Heatmap")
plt.show()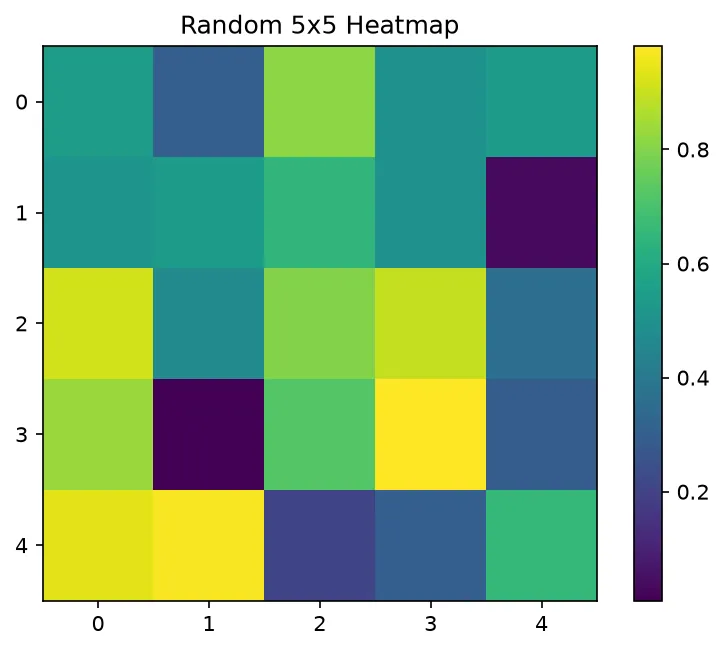
What you'll see: a 5×5 checkerboard of colors ranging from dark purple (low values near 0) through green to bright yellow (high values near 1). The colorbar on the right maps each shade back to its numeric value.
2 Labeling Axes and Choosing Colormaps
Real heatmaps have meaningful axis labels. Use plt.xticks() and plt.yticks() to replace the default 0, 1, 2… with category names, and switch the cmap to fit your data.
import numpy as np
import matplotlib.pyplot as plt

# A correlation-like 3x3 matrix
corr = np.array([
    [1.0, 0.8, 0.2],
    [0.8, 1.0, 0.5],
    [0.2, 0.5, 1.0],
])

labels = ["Price", "Size", "Age"]

plt.imshow(corr, cmap="coolwarm")
plt.colorbar()

# Put category names on both axes
plt.xticks(range(3), labels)
plt.yticks(range(3), labels)

plt.title("Correlation Matrix")
plt.show()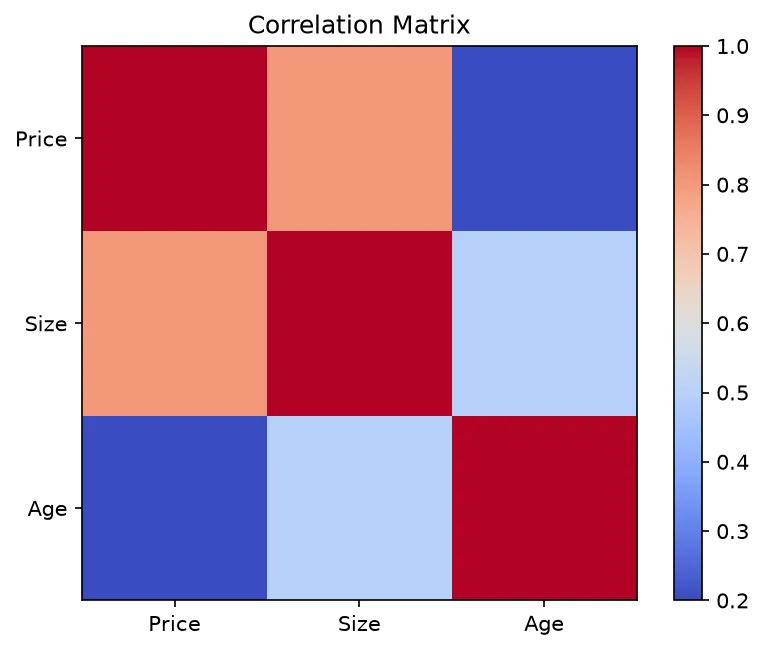
What you'll see: a 3×3 grid where the diagonal (each variable with itself, 1.0) is the deepest red. The "Price"/"Size" cells are also warm because 0.8 is a strong correlation, while the cooler, bluer cells show weaker relationships. Both axes now read Price, Size, Age.
3 Annotating Each Cell with Its Value
A heatmap shows patterns, but readers often want the exact numbers too. Loop over the grid and call plt.text() to print each value in the center of its square.
import numpy as np
import matplotlib.pyplot as plt

data = np.array([
    [3, 7, 2],
    [8, 1, 6],
    [4, 5, 9],
])

plt.imshow(data, cmap="viridis", aspect="auto")
plt.colorbar()

# Write each value on top of its cell
for row in range(data.shape[0]):
    for col in range(data.shape[1]):
        plt.text(col, row, data[row, col],
                 ha="center", va="center", color="white")

plt.title("Annotated Heatmap")
plt.show()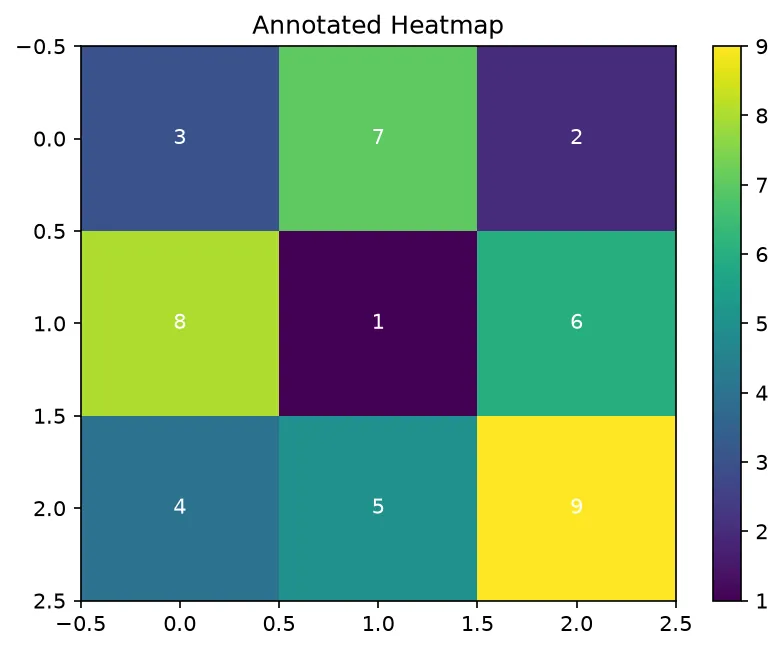
What you'll see: the same colored grid, but now each square has its number printed in white in the middle. The double loop visits every (row, col) position, and aspect="auto" lets the cells stretch to fill the figure rather than staying perfectly square.
🎯 Your Turn: Fill in the Blanks
Replace each ___ to draw a heatmap with a colorbar.
import numpy as np
import matplotlib.pyplot as plt

data = np.random.rand(4, 4)

# Draw the grid with the 'plasma' colormap
plt.imshow(data, cmap="___")

# Add the color legend
plt.___()

# Display the chart
plt.show()
📋 Common Errors & Quick Reference
❌ TypeError: Invalid shape for image data
imshow needs a 2D array. Passing a flat 1D list won't work — reshape it or build a real grid first.
❌ Cell labels are invisible
Dark text on dark cells disappears. Set color="white" (or pick a lighter colormap) so the numbers stand out.
| Call | What It Does |
|---|---|
| plt.imshow(data, cmap='viridis') | Draw a 2D array as colors |
| plt.colorbar() | Add the color-to-value legend |
| plt.xticks(range(n), labels) | Custom axis labels |
| plt.text(col, row, val) | Annotate a single cell |
🏆 Mini Challenge: Monthly Sales Grid
Draw a heatmap of sales by region and month, with a colorbar and a title.
import numpy as np
import matplotlib.pyplot as plt

# Rows = regions, columns = months
sales = np.array([
    [120, 140, 160],
    [90, 130, 150],
    [200, 180, 220],
])

# 1. Draw the heatmap
plt.imshow(sales, cmap="viridis", aspect="auto")

# 2. Add a colorbar
plt.colorbar()

# 3. Label and show
plt.xticks(range(3), ["Jan", "Feb", "Mar"])
plt.yticks(range(3), ["North", "South", "West"])
plt.title("Sales Heatmap")
plt.show()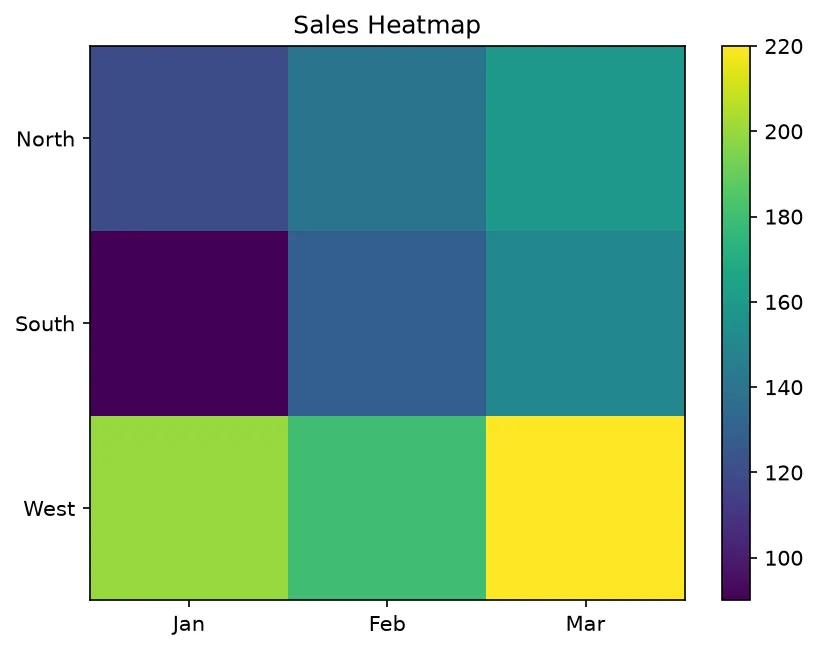
import matplotlib.pyplot as plt

grid = [[1, 2, 3],
        [4, 5, 6],
        [7, 8, 9]]

fig, ax = plt.subplots()
im = ax.imshow(grid, cmap="magma")
ax.set_xticks(range(3), labels=["Mon", "Tue", "Wed"])
ax.set_yticks(range(3), labels=["A", "B", "C"])
bar = fig.colorbar(im, ax=ax)

print("Data shape:", im.get_array().shape)
print("Colour range:", [int(v) for v in im.get_clim()])
print("Colormap:", im.get_cmap().name)
print("X tick labels:", [t.get_text() for t in ax.get_xticklabels()])
print("Y tick labels:", [t.get_text() for t in ax.get_yticklabels()])
print("Colourbar added an axes:", len(fig.axes) == 2)

# ✅ Expected output:
# Data shape: (3, 3)
# Colour range: [1, 9]
# Colormap: magma
# X tick labels: ['Mon', 'Tue', 'Wed']
# Y tick labels: ['A', 'B', 'C']
# Colourbar added an axes: True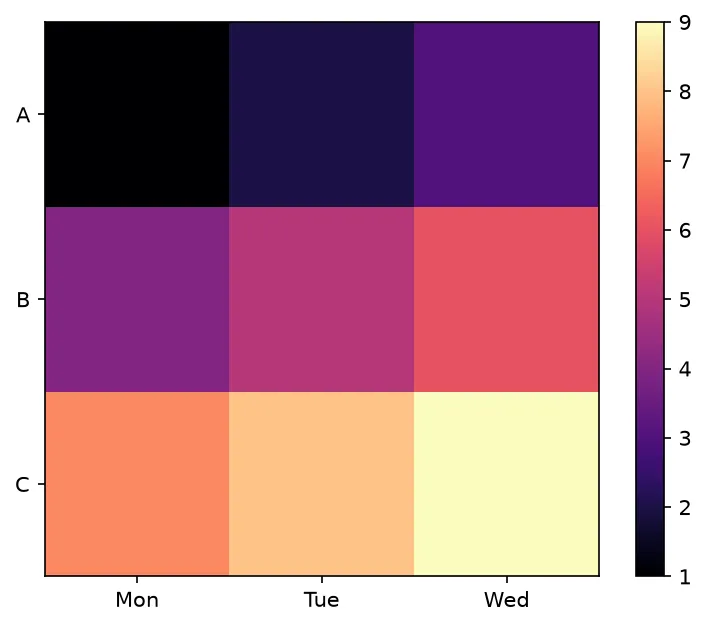
❓ Frequently Asked Questions
Lesson complete — you can paint data as color!
You drew heatmaps with imshow, added colorbars, labeled the axes with categories, and annotated every cell with its value.
Practice quiz
What does a heatmap display?
- A 2D grid of numbers as a grid of colors
- A line over time
- A single bar per category
- A pie of proportions
Answer: A 2D grid of numbers as a grid of colors. A heatmap encodes each cell's value as a color in a 2D grid.
Which function draws a 2D array as colored cells?
- plt.heatmap()
- plt.imshow()
- plt.grid()
- plt.matrix()
Answer: plt.imshow(). plt.imshow(data) treats a 2D array like an image, one colored pixel per value.
What does the cmap argument choose?
- The cell size
- The colormap (number-to-color mapping)
- The number of bins
- The aspect ratio
Answer: The colormap (number-to-color mapping). cmap selects the colormap that maps numbers to colors, e.g. 'viridis'.
Which call adds a legend mapping colors back to values?
- plt.legend()
- plt.key()
- plt.colorbar()
- plt.scale()
Answer: plt.colorbar(). plt.colorbar() adds the color-to-value legend strip beside the heatmap.
Which is Matplotlib's default, perceptually uniform colormap?
- jet
- gray
- viridis
- rainbow
Answer: viridis. 'viridis' is the default and is perceptually uniform.
For data ranging negative to positive (like correlations), a good colormap is...
- A diverging map like 'coolwarm'
- 'viridis'
- 'gray'
- 'hot'
Answer: A diverging map like 'coolwarm'. A diverging colormap such as 'coolwarm' centers neutral values on white.
How do you write each cell's value on top of its square?
- plt.annotate_grid()
- plt.text(col, row, value) in a loop
- plt.label()
- plt.cell_text()
Answer: plt.text(col, row, value) in a loop. Loop over rows and columns and call plt.text(col, row, value, ha='center', va='center').
Why does imshow raise 'Invalid shape for image data' on a flat 1D list?
- The list is empty
- imshow needs a 2D array, not a flat 1D list
- cmap is missing
- colorbar wasn't called
Answer: imshow needs a 2D array, not a flat 1D list. imshow needs a 2D array; reshape or build a real grid first.
Why might cell labels be invisible on a heatmap?
- The colorbar overwrote them
- Dark text on dark cells disappears
- imshow hides text
- plt.text() is deprecated
Answer: Dark text on dark cells disappears. Set color='white' (or use a lighter colormap) so dark cells don't hide the numbers.
How do you replace default 0,1,2 tick labels with category names?
- plt.relabel()
- plt.xticks(range(n), labels)
- plt.names(labels)
- plt.set_labels()
Answer: plt.xticks(range(n), labels). plt.xticks(range(n), labels) puts category names on the axis.
Continue this course
- Previous: Plotting with Pandas
- Next: 3D Plots — Render 3D surfaces and scatter plots with mplot3d
- Quick reference: Matplotlib cheat sheet
Frequently asked questions
What is a heatmap?
A heatmap displays a 2D grid of numbers as a grid of colors, where the color of each cell encodes its value. It's perfect for correlation matrices, confusion matrices, and any table where you want to spot patterns at a glance.
How do I draw a heatmap in Matplotlib?
Use plt.imshow(data, cmap='viridis'). It treats a 2D array as an image: each value becomes a colored pixel. Add plt.colorbar() so readers can map colors back to numbers.
What does cmap do?
cmap chooses the colormap — the mapping from numbers to colors. 'viridis' is the default and is perceptually uniform; others include 'plasma', 'coolwarm', and 'gray'.
How do I label the cells with their values?
Loop over the rows and columns and call plt.text(col, row, value, ha='center', va='center') for each cell. This writes each number on top of its colored square.