3D Plots
Reviewed & published by Brayan K
Matplotlib is a Python library for creating charts and visualizations — and with its 3D toolkit it can draw surfaces and scatter points across three axes, not just two.
Part of the free Matplotlib course at LearnCodingFast — hands-on lessons with worked examples and the output they print, plus practice exercises and a quick quiz.
In this lesson you'll create a 3D Axes, plot a colorful surface from a coordinate grid, and scatter points in space with x, y, and z labels.
What You'll Learn in This Lesson
- Creating a 3D Axes with projection='3d'
- Building coordinate grids with np.meshgrid
- Drawing surfaces with ax.plot_surface
- Scattering points in 3D with ax.scatter
- Drawing 3D line plots with ax.plot
- Labeling the x, y, and z axes
1 Creating a 3D Axes
A 3D plot lives on a special Axes. You ask for one by passing projection='3d' when you add the subplot. That single argument unlocks methods like scatter and plot in three dimensions.
📊 What can a 3D Axes draw?
- Scatter clouds of points in space
- Surfaces — a landscape of z heights over an x-y grid
- 3D line plots and curves
- Wireframes and bar charts in 3D
Start with a simple 3D scatter:
import numpy as np
import matplotlib.pyplot as plt

# Some random points in 3D
xs = np.random.rand(30)
ys = np.random.rand(30)
zs = np.random.rand(30)

fig = plt.figure()
# The key: ask for a 3D projection
ax = fig.add_subplot(111, projection="3d")

ax.scatter(xs, ys, zs)

ax.set_xlabel("X")
ax.set_ylabel("Y")
ax.set_zlabel("Z")
plt.show()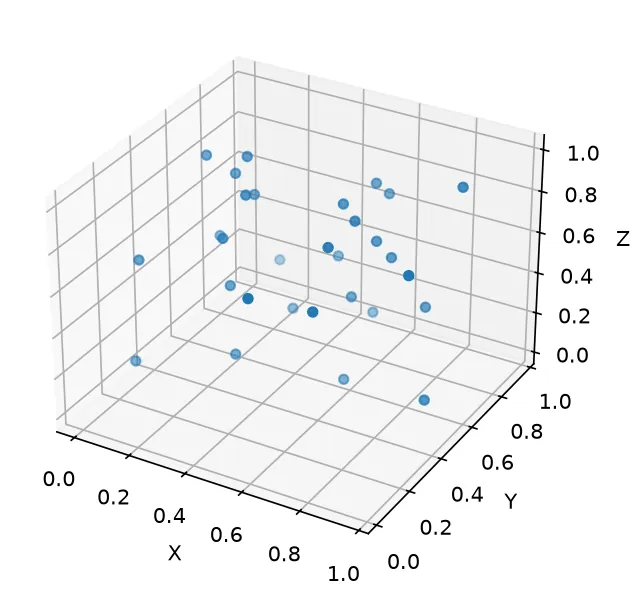
What you'll see: a cube-shaped plot box with 30 dots floating inside it at random x, y, and z positions. Because it's a 3D Axes, you can rotate it with the mouse in an interactive window, and all three axes are clearly labeled X, Y, and Z.
2 Surface Plots with meshgrid
A surface is a height (z) at every point on an x-y grid. np.meshgrid builds that grid for you, and ax.plot_surface drapes a colored sheet over it.
import numpy as np
import matplotlib.pyplot as plt

# 1D ranges for the two horizontal axes
x = np.linspace(-5, 5, 50)
y = np.linspace(-5, 5, 50)

# Expand into a full 2D coordinate grid
X, Y = np.meshgrid(x, y)

# A height for every (X, Y) point
Z = np.sin(np.sqrt(X**2 + Y**2))

fig = plt.figure()
ax = fig.add_subplot(111, projection="3d")

ax.plot_surface(X, Y, Z, cmap="viridis")

ax.set_xlabel("X")
ax.set_ylabel("Y")
ax.set_zlabel("Z")
plt.show()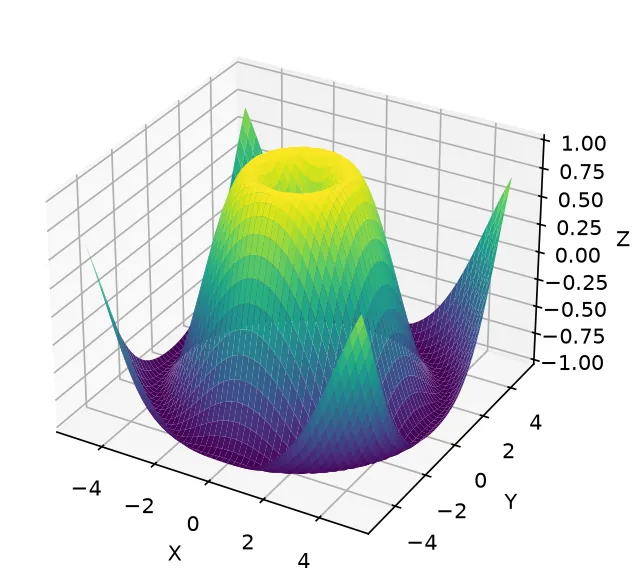
What you'll see: a smooth, rippling surface that looks like waves spreading out from the center — the classic "sombrero" shape of sin(sqrt(x² + y²)). The viridis colormap shades high peaks yellow and low troughs purple.
3 3D Line Plots
The same ax.plot you know from 2D works in 3D too — just pass a third list of z values. A parametric curve like a helix is a perfect example.
import numpy as np
import matplotlib.pyplot as plt

# A spiral climbing upward
t = np.linspace(0, 20, 200)
x = np.cos(t)
y = np.sin(t)
z = t

fig = plt.figure()
ax = fig.add_subplot(111, projection="3d")

# plot() takes x, y AND z in 3D
ax.plot(x, y, z)

ax.set_xlabel("X")
ax.set_ylabel("Y")
ax.set_zlabel("Z (height)")
ax.set_title("A 3D Helix")
plt.show()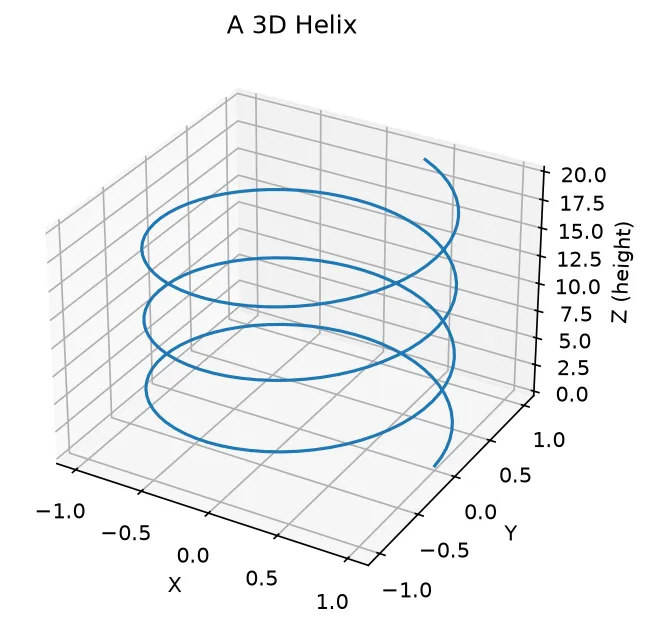
What you'll see: a spring-like spiral coiling upward. As t grows, x and y trace a circle while z keeps rising, so the line winds around and climbs — exactly like a stretched-out helix.
🎯 Your Turn: Fill in the Blanks
Replace each ___ to create a 3D Axes and scatter points.
import numpy as np
import matplotlib.pyplot as plt

xs = np.random.rand(20)
ys = np.random.rand(20)
zs = np.random.rand(20)

fig = plt.figure()
# Ask for a 3D projection
ax = fig.add_subplot(111, projection="___")

# Scatter the points in 3D
ax.___(xs, ys, zs)

ax.set_zlabel("Z")
plt.show()
📋 Common Errors & Quick Reference
❌ AttributeError: 'Axes' object has no attribute 'set_zlabel'
You forgot projection='3d'. A plain 2D Axes has no z-axis, so 3D methods don't exist on it.
❌ plot_surface gives a shape error
X, Y, and Z must all be 2D and the same shape. Build X and Y with np.meshgrid, then compute Z from them.
| Call | What It Does |
|---|---|
| fig.add_subplot(111, projection='3d') | Make a 3D Axes |
| ax.scatter(x, y, z) | 3D scatter plot |
| ax.plot_surface(X, Y, Z) | Draw a surface |
| ax.set_zlabel('Z') | Label the z-axis |
🏆 Mini Challenge: A Paraboloid Surface
Build a bowl-shaped surface from z = x² + y² and label all three axes.
import numpy as np
import matplotlib.pyplot as plt

x = np.linspace(-3, 3, 40)
y = np.linspace(-3, 3, 40)
X, Y = np.meshgrid(x, y)

# 1. Height is a bowl shape
Z = X**2 + Y**2

# 2. Make a 3D Axes
fig = plt.figure()
ax = fig.add_subplot(111, projection="3d")

# 3. Draw the surface and label it
ax.plot_surface(X, Y, Z, cmap="plasma")
ax.set_xlabel("X")
ax.set_ylabel("Y")
ax.set_zlabel("Z")
plt.show()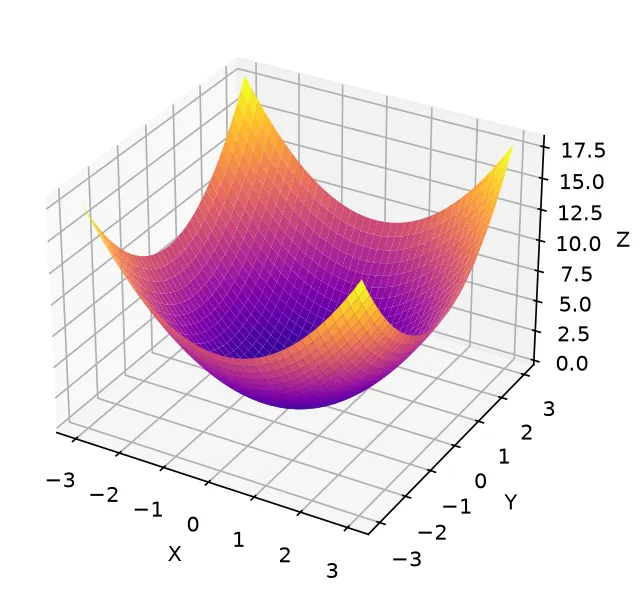
import matplotlib.pyplot as plt

xs = [1, 2, 3, 4]
ys = [4, 3, 2, 1]
zs = [1, 4, 9, 16]

fig = plt.figure()
ax = fig.add_subplot(projection="3d")
ax.scatter(xs, ys, zs)
ax.set_xlabel("x")
ax.set_ylabel("y")
ax.set_zlabel("z")

print("Projection:", ax.name)
print("Axis labels:", ax.get_xlabel(), ax.get_ylabel(), ax.get_zlabel())
print("Points:", len(zs))
print("Highest z:", max(zs), "at (x, y) =", (xs[zs.index(max(zs))], ys[zs.index(max(zs))]))
print("Collections on the axes:", len(ax.collections))
print("Three axes, not two:", hasattr(ax, "get_zlim"))

# ✅ Expected output:
# Projection: 3d
# Axis labels: x y z
# Points: 4
# Highest z: 16 at (x, y) = (4, 1)
# Collections on the axes: 1
# Three axes, not two: True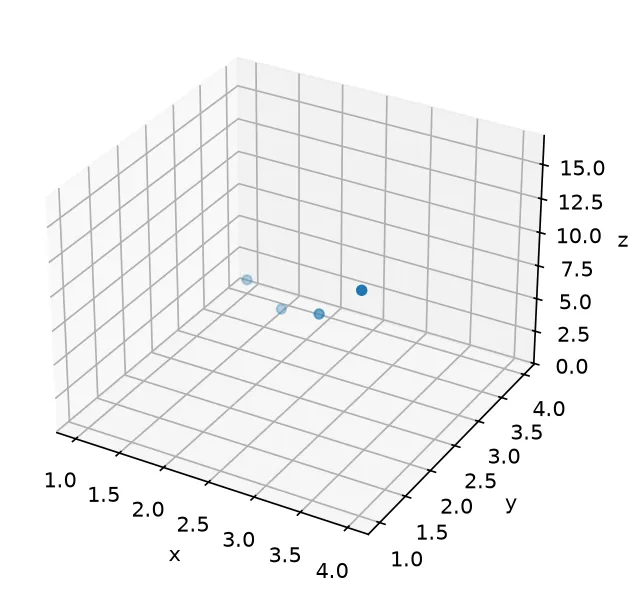
❓ Frequently Asked Questions
Lesson complete — your charts now have depth!
You created 3D Axes, scattered points in space, drew surfaces from a meshgrid, plotted a helix, and labeled all three axes.
Practice quiz
How do you create a 3D Axes when adding a subplot?
- fig.add_subplot(111, kind='3d')
- fig.add_subplot(111, projection='3d')
- fig.add_3d_subplot(111)
- fig.add_subplot(111, dim=3)
Answer: fig.add_subplot(111, projection='3d'). Pass projection='3d' to add_subplot to get a 3D Axes.
In modern Matplotlib, do you still need to import Axes3D?
- Yes, always
- Only on Linux
- No — projection='3d' is enough on its own
- Only for scatter plots
Answer: No — projection='3d' is enough on its own. projection='3d' alone works; importing Axes3D is no longer required.
Which method labels the z-axis?
- ax.set_xlabel()
- ax.set_ylabel()
- ax.label_z()
- ax.set_zlabel()
Answer: ax.set_zlabel(). ax.set_zlabel() names the z-axis on a 3D Axes.
What does np.meshgrid(x, y) produce for a surface plot?
- Two 2D coordinate grids X and Y
- A single flat list
- A 3D array of z values
- A list of colors
Answer: Two 2D coordinate grids X and Y. meshgrid expands two 1D arrays into 2D coordinate grids X and Y.
Which method draws a colored surface over an x-y grid?
- ax.surface()
- ax.plot_surface(X, Y, Z)
- ax.fill_3d(X, Y, Z)
- ax.mesh(X, Y, Z)
Answer: ax.plot_surface(X, Y, Z). ax.plot_surface(X, Y, Z) drapes a colored sheet over the grid.
How do you scatter points in 3D space?
- ax.points3d(x, y, z)
- ax.dots(x, y, z)
- ax.scatter(x, y, z)
- ax.scatter3d(x, y, z)
Answer: ax.scatter(x, y, z). ax.scatter(x, y, z) plots points in three dimensions on a 3D Axes.
How do you draw a 3D line such as a helix?
- ax.line3d(x, y, z)
- ax.curve(x, y, z)
- ax.plot3d(x, y, z)
- ax.plot(x, y, z)
Answer: ax.plot(x, y, z). The familiar ax.plot also works in 3D — just pass a third z argument.
What requirement must X, Y, and Z meet for plot_surface?
- All 2D and the same shape
- All 1D arrays
- Z must be a scalar
- X and Y must be lists of strings
Answer: All 2D and the same shape. X, Y, and Z must all be 2D and the same shape, built via meshgrid.
What error means you forgot projection='3d'?
- ValueError: bad projection
- ImportError: no mplot3d
- AttributeError: 'Axes' object has no attribute 'set_zlabel'
- KeyError: '3d'
Answer: AttributeError: 'Axes' object has no attribute 'set_zlabel'. A plain 2D Axes has no z-axis, so set_zlabel does not exist on it.
What argument adds a colormap to a surface plot?
- color='viridis'
- palette='viridis'
- shade='viridis'
- cmap='viridis'
Answer: cmap='viridis'. cmap='viridis' shades the surface by height with the viridis colormap.
Continue this course
- Previous: Heatmaps & imshow
- Next: Customizing with rcParams — Set global defaults for fonts, colors, and sizes with rcParams
- Quick reference: Matplotlib cheat sheet
Frequently asked questions
How do I make a 3D plot in Matplotlib?
Create an Axes with a 3D projection: ax = fig.add_subplot(111, projection='3d'). That ax then has 3D methods like plot_surface, scatter, and plot for drawing in x, y, and z.
Do I need to import Axes3D?
In modern Matplotlib, projection='3d' is enough on its own. Some older code still writes 'from mpl_toolkits.mplot3d import Axes3D' — it does no harm but is no longer required.
What is np.meshgrid used for in 3D plots?
Surface plots need a full grid of x and y coordinates. np.meshgrid takes two 1D arrays and expands them into 2D coordinate grids X and Y, so you can compute a Z value at every point.
How do I label the three axes?
Use ax.set_xlabel(), ax.set_ylabel(), and the 3D-only ax.set_zlabel() to name the x, y, and z axes respectively.