Customizing with rcParams
Reviewed & published by Brayan K
Matplotlib is a Python library for creating charts and visualizations — and rcParams is the global settings dictionary that controls how every one of those charts looks by default.
Part of the free Matplotlib course at LearnCodingFast — hands-on lessons with worked examples and the output they print, plus practice exercises and a quick quiz.
In this lesson you'll change defaults like figure size, font size, and line width once, so every chart you draw afterward inherits your style automatically.
What You'll Learn in This Lesson
- What rcParams is and why it's global
- Setting one default with plt.rcParams['key']
- Setting many at once with rcParams.update()
- Common keys: figsize, font.size, linewidth
- Turning grids on globally with axes.grid
- Resetting everything with plt.rcdefaults()
1 What rcParams Is
rcParams ("runtime configuration parameters") is a big dictionary holding every default Matplotlib uses. Change a value here and it becomes the new default for all charts you draw next.
📊 Things you can set globally
- Figure size — figure.figsize
- Default font size — font.size
- Line thickness — lines.linewidth
- Whether grids show — axes.grid
Set a couple of defaults, then draw a chart that inherits them:
import matplotlib.pyplot as plt

# Set GLOBAL defaults before plotting
plt.rcParams["figure.figsize"] = (8, 5)
plt.rcParams["font.size"] = 12

x = [1, 2, 3, 4, 5]
y = [10, 14, 12, 20, 24]

# This chart automatically uses the new size and font
plt.plot(x, y)
plt.title("Styled by rcParams")
plt.show()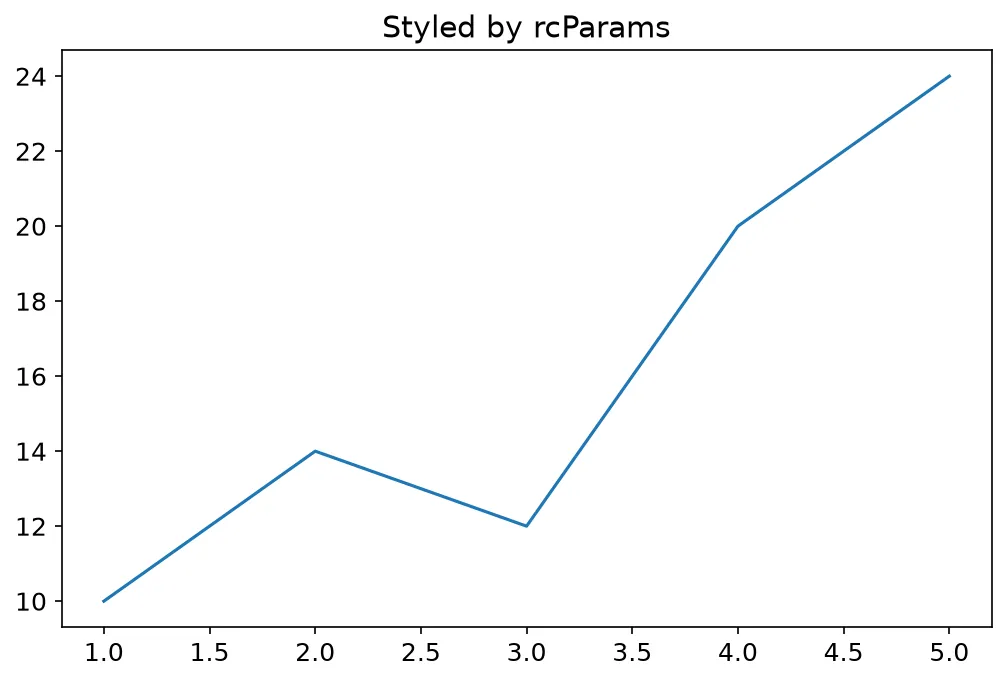
What you'll see: a line chart that is noticeably wider (8×5 inches) with larger title and tick text (12-point font). You didn't pass figsize to this plot — it inherited the default you set in rcParams.
2 Updating Many Settings at Once
Setting keys one at a time gets repetitive. plt.rcParams.update() takes a dictionary so you can apply a whole theme in one call. You can also reach rcParams through matplotlib itself as mpl.rcParams.
import matplotlib as mpl
import matplotlib.pyplot as plt

# Apply a whole "theme" in one update call
plt.rcParams.update({
    "figure.figsize": (7, 4),
    "font.size": 11,
    "axes.grid": True,        # show a grid on every chart
})

# Same object reached a different way
mpl.rcParams["lines.linewidth"] = 2

x = [1, 2, 3, 4, 5]
y = [3, 8, 5, 12, 9]

plt.plot(x, y)
plt.title("Themed with update()")
plt.show()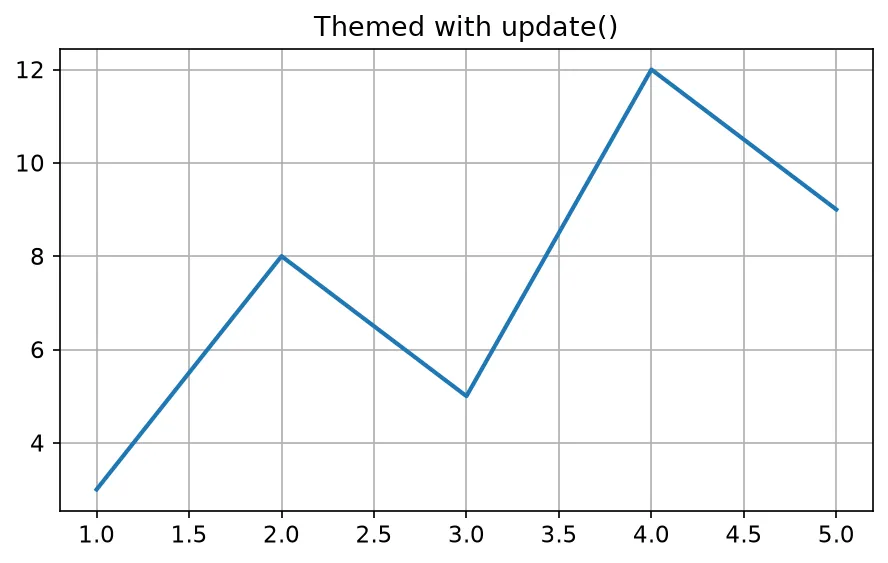
What you'll see: a thicker line (width 2) on a chart that now has light grid lines behind it — because axes.grid was switched on globally. Every future plot in this session keeps the grid until you change it back.
3 Resetting Back to Defaults
Because rcParams changes are global and sticky, you sometimes want a clean slate. plt.rcdefaults() restores every setting to Matplotlib's factory values.
import matplotlib.pyplot as plt

# Make some bold changes
plt.rcParams["lines.linewidth"] = 5
plt.rcParams["font.size"] = 20

# ...then undo ALL of them
plt.rcdefaults()

x = [1, 2, 3, 4]
y = [1, 4, 9, 16]

# This chart uses the original defaults again
plt.plot(x, y)
plt.title("Back to Defaults")
plt.show()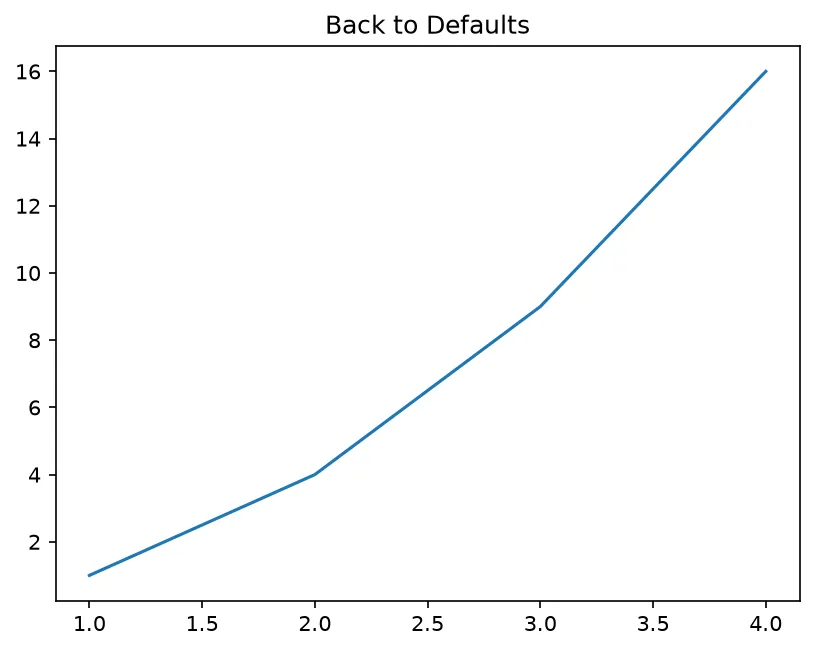
What you'll see: a normal-looking chart with a thin line and standard font — even though you set a chunky 5-point line width and giant 20-point font just above. rcdefaults() wiped those customizations before the plot was drawn.
🎯 Your Turn: Fill in the Blanks
Replace each ___ to set a global figure size and enable grids.
import matplotlib.pyplot as plt

# Set the default figure size to 9 x 5
plt.rcParams["figure.___"] = (9, 5)

# Turn the grid on for every chart
plt.rcParams["axes.grid"] = ___

plt.plot([1, 2, 3], [4, 5, 6])
plt.show()
📋 Common Errors & Quick Reference
The full key is 'figure.figsize', not just 'figsize'. rcParams keys are dotted strings — check the exact name.
❌ My change didn't affect the chart
Set rcParams before you create the figure. Changing a default after a chart already exists won't restyle it.
| Call | What It Does |
|---|---|
| plt.rcParams['figure.figsize'] = (8, 5) | Default figure size |
| plt.rcParams['font.size'] = 12 | Default font size |
| plt.rcParams.update({...}) | Set many at once |
| plt.rcdefaults() | Reset to factory defaults |
🏆 Mini Challenge: Build Your Own Theme
Apply a custom theme with update(), draw a chart, then reset the defaults.
import matplotlib.pyplot as plt

# 1. Apply a theme
plt.rcParams.update({
    "figure.figsize": (8, 5),
    "font.size": 13,
    "lines.linewidth": 3,
    "axes.grid": True,
})

# 2. Draw a chart that uses it
plt.plot([1, 2, 3, 4], [2, 5, 3, 8])
plt.title("My Custom Theme")
plt.show()

# 3. Reset for the next chart
plt.rcdefaults()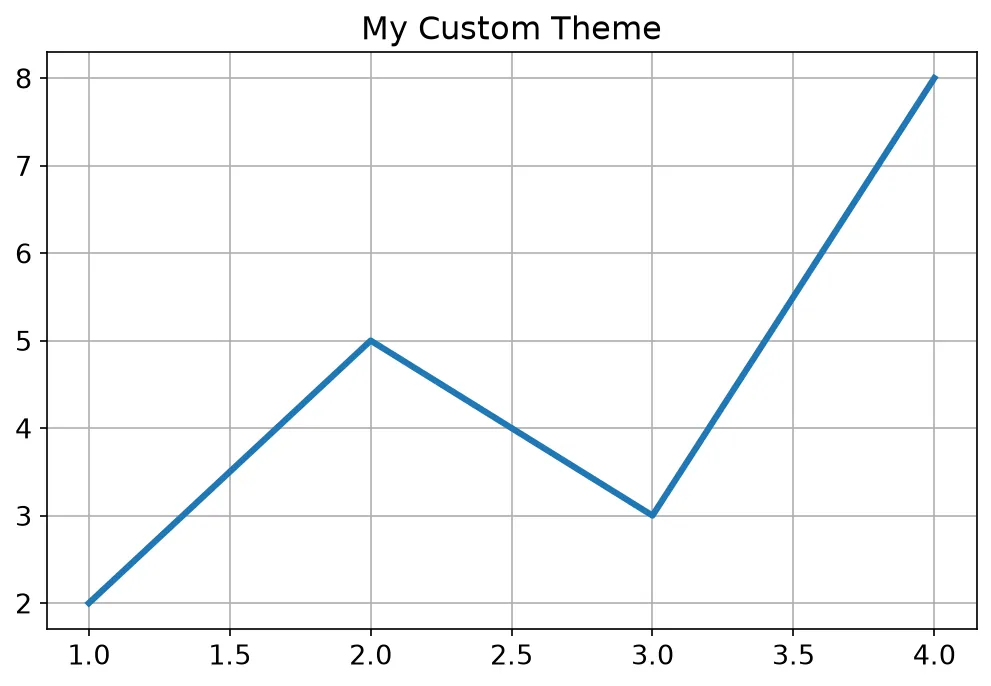
import matplotlib as mpl
import matplotlib.pyplot as plt

before = mpl.rcParams["lines.linewidth"]

with mpl.rc_context({"lines.linewidth": 4, "axes.grid": True, "font.size": 14}):
    inside_width = mpl.rcParams["lines.linewidth"]
    inside_grid = mpl.rcParams["axes.grid"]
    fig, ax = plt.subplots()
    ax.plot([1, 2, 3], [1, 4, 9])
    drawn_width = ax.lines[0].get_linewidth()

after = mpl.rcParams["lines.linewidth"]

print("Default line width:", before)
print("Inside the context:", inside_width)
print("The line really used it:", drawn_width)
print("Grid on inside:", inside_grid)
print("Back to the default afterwards:", after == before)
print("rc_context undoes everything on exit:", mpl.rcParams["axes.grid"] is False)

# ✅ Expected output:
# Default line width: 1.5
# Inside the context: 4.0
# The line really used it: 4.0
# Grid on inside: True
# Back to the default afterwards: True
# rc_context undoes everything on exit: True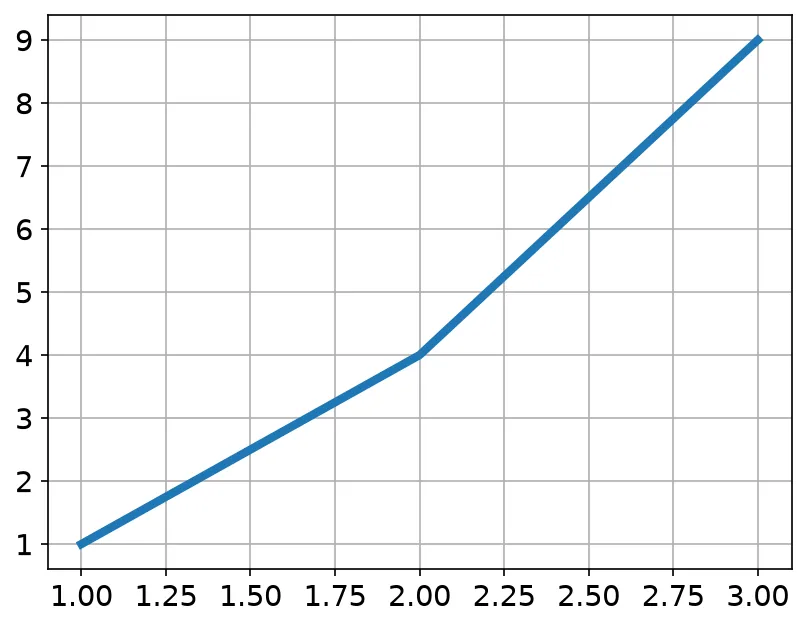
❓ Frequently Asked Questions
Lesson complete — you control Matplotlib's global style!
You set global defaults through rcParams, applied a whole theme with update(), enabled grids everywhere, and reset to factory settings with rcdefaults().
Practice quiz
What is rcParams in Matplotlib?
- A list of chart types
- The global configuration dictionary of defaults
- A plotting function
- A colormap
Answer: The global configuration dictionary of defaults. rcParams holds every global default Matplotlib uses for new charts.
How do you set the default font size to 12?
- plt.rcParams['font.size'] = 12
- plt.fontsize(12)
- plt.set_font(12)
- plt.rc('font', 12)
Answer: plt.rcParams['font.size'] = 12. Assign to the key: plt.rcParams['font.size'] = 12.
Which method sets several rcParams at once?
- plt.rcParams.set_all()
- plt.rcParams.batch()
- plt.rcParams.update({...})
- plt.rcParams.many()
Answer: plt.rcParams.update({...}). plt.rcParams.update() takes a dictionary to apply a whole theme at once.
What is the full key for the default figure size?
- 'figsize'
- 'figure.size'
- 'fig.figsize'
- 'figure.figsize'
Answer: 'figure.figsize'. The dotted key is 'figure.figsize'; just 'figsize' raises KeyError.
Which call resets every rcParam to factory defaults?
- plt.rcdefaults()
- plt.reset()
- plt.clear_rc()
- plt.rcParams.clear()
Answer: plt.rcdefaults(). plt.rcdefaults() restores Matplotlib's original default settings.
Which rcParams key turns the grid on for every chart?
- 'grid.on'
- 'axes.grid'
- 'show.grid'
- 'grid.visible'
Answer: 'axes.grid'. Set plt.rcParams['axes.grid'] = True to show grids globally.
When should you set rcParams to affect a chart?
- After plt.show()
- It does not matter when
- Before you create the figure
- Only inside plt.plot()
Answer: Before you create the figure. Set rcParams before creating the figure; changes after won't restyle it.
Which key sets the default line thickness?
- 'lines.width'
- 'line.thickness'
- 'linewidth'
- 'lines.linewidth'
Answer: 'lines.linewidth'. plt.rcParams['lines.linewidth'] controls the default line width.
How are plt.rcParams and mpl.rcParams related?
- They are the exact same object
- mpl.rcParams is read-only
- They are unrelated
- plt.rcParams is faster
Answer: They are the exact same object. Both names point to the very same configuration object.
What raises KeyError: 'figsize'?
- Using rcParams.update
- Using the key 'figsize' instead of 'figure.figsize'
- Setting font.size
- Calling rcdefaults
Answer: Using the key 'figsize' instead of 'figure.figsize'. rcParams keys are dotted strings; the correct key is 'figure.figsize'.
Continue this course
- Previous: 3D Plots
- Next: Box & Violin Plots — Show distributions and outliers with boxplot and violinplot
- Quick reference: Matplotlib cheat sheet
Frequently asked questions
What are rcParams?
rcParams is Matplotlib's global configuration dictionary. Every default — figure size, font size, line width, grid visibility — lives here. Changing a value in plt.rcParams affects every chart you draw afterward.
How do I change a default like font size?
Assign to the key: plt.rcParams['font.size'] = 12. To set several at once, use plt.rcParams.update({...}) with a dictionary of key/value pairs.
What's the difference between rcParams and per-chart settings?
rcParams sets GLOBAL defaults applied to all future plots. Calling ax.set_title() or plt.xlabel() changes only the current chart. Use rcParams to avoid repeating the same styling on every plot.
How do I undo my rcParams changes?
Call plt.rcdefaults() to reset every rcParam back to Matplotlib's factory defaults. It's a clean way to start over if your styling got messy.