Box & Violin Plots
Reviewed & published by Brayan K
A box plot is a compact chart that summarizes a distribution with its median, quartiles, and outliers, while a violin plot wraps that same summary in a smoothed density curve to reveal the shape of the data.
Part of the free Matplotlib course at LearnCodingFast — hands-on lessons with worked examples and the output they print, plus practice exercises and a quick quiz.
In this lesson you'll draw box plots for several groups at once, customize whiskers and outliers, switch to violin plots, and learn to read quartiles and spread at a glance.
What You'll Learn in This Lesson
- Drawing a box plot with ax.boxplot()
- Comparing several groups with labels
- Reading the median, quartiles, and outliers
- Tuning notch, showfliers, and whiskers
- Drawing density with ax.violinplot()
- Choosing box or violin over a histogram
1 Your First Box Plot
A box plot turns a column of numbers into a five-number summary. The box spans the middle 50% of the data — from the first quartile (Q1) to the third quartile (Q3) — and the line inside the box marks the median. The whiskers reach out to the smallest and largest values that aren't considered outliers. Pass one array to ax.boxplot() to get started.
import matplotlib.pyplot as plt
import numpy as np

# Reproducible random data: 200 exam scores
rng = np.random.default_rng(42)
scores = rng.normal(loc=72, scale=10, size=200)

fig, ax = plt.subplots()
ax.boxplot(scores)

ax.set_title("Exam Scores: One Box Plot")
ax.set_ylabel("Score")
ax.set_xticklabels(["Class A"])

plt.show()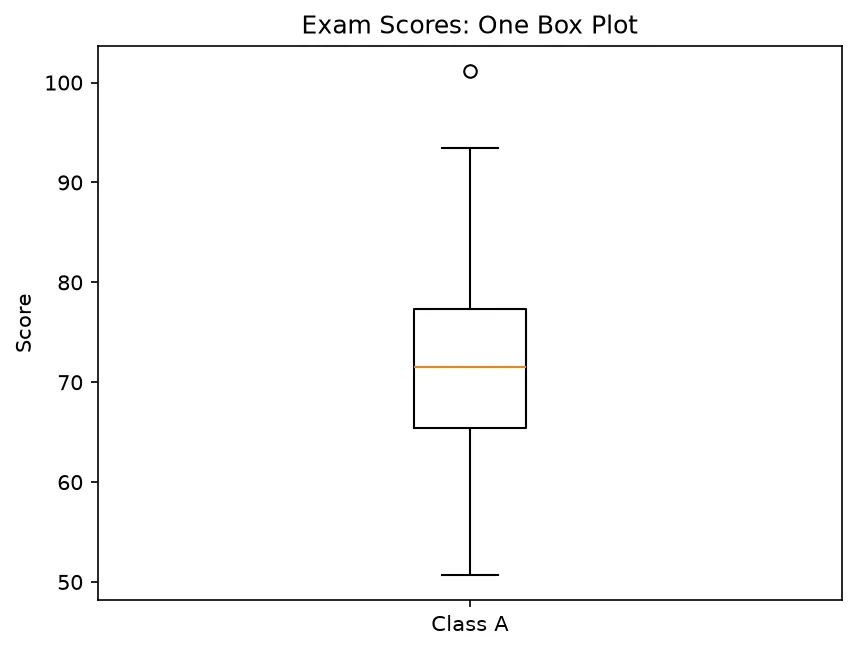
What you'll see: a single vertical box centered near 72. The orange line inside marks the median, the box edges sit around 65 and 79, and the whiskers stretch out to roughly 45 and 100. A few stray circles beyond the whiskers flag the unusual scores.
2 Comparing Groups, Notch & Outliers
The real power of box plots shows up when you compare several groups. Pass a list of arrays and Matplotlib draws one box per array. Name each box with tick_labels. Two handy options: notch=True pinches the box around the median to hint at a confidence interval, and showfliers=False hides the outlier dots when they clutter the view.
import matplotlib.pyplot as plt
import numpy as np

rng = np.random.default_rng(7)

# Three branches with different spreads
north = rng.normal(50, 5, 100)
south = rng.normal(60, 12, 100)
east  = rng.normal(55, 8, 100)

fig, ax = plt.subplots()
ax.boxplot([north, south, east],
           tick_labels=["North", "South", "East"],
           notch=True,
           showfliers=True)

ax.set_title("Daily Sales by Branch")
ax.set_ylabel("Units Sold")

plt.show()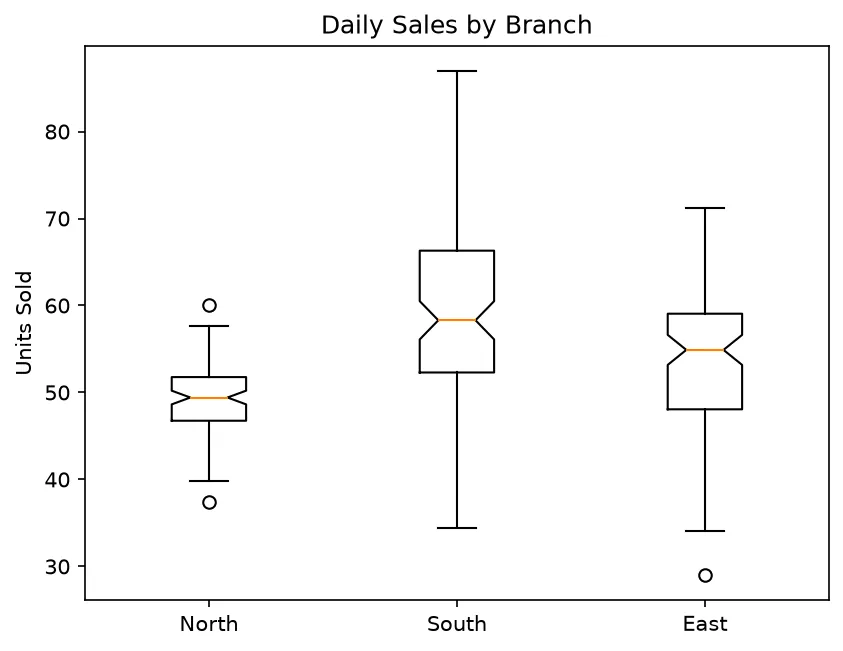
What you'll see: three boxes side by side. South is the tallest box (largest spread) and sits highest, North is short and compact, and the pinched notches near each median make it easy to judge whether the typical values really differ between branches.
3 Violin Plots: Seeing the Shape
A box plot hides one thing: the shape of the distribution. Two groups can share the same median and quartiles yet look completely different — one bell-shaped, one with two peaks. A violin plot fixes this by drawing a mirrored density curve. Call ax.violinplot() and turn on showmedians=True to mark the center.
import matplotlib.pyplot as plt
import numpy as np

rng = np.random.default_rng(3)

# One bell-shaped group, one with two peaks
single_peak = rng.normal(50, 8, 300)
two_peaks = np.concatenate([rng.normal(35, 4, 150),
                            rng.normal(65, 4, 150)])

fig, ax = plt.subplots()
parts = ax.violinplot([single_peak, two_peaks],
                      showmedians=True)

ax.set_xticks([1, 2])
ax.set_xticklabels(["One Peak", "Two Peaks"])
ax.set_title("Violin Plots Reveal Shape")
ax.set_ylabel("Value")

plt.show()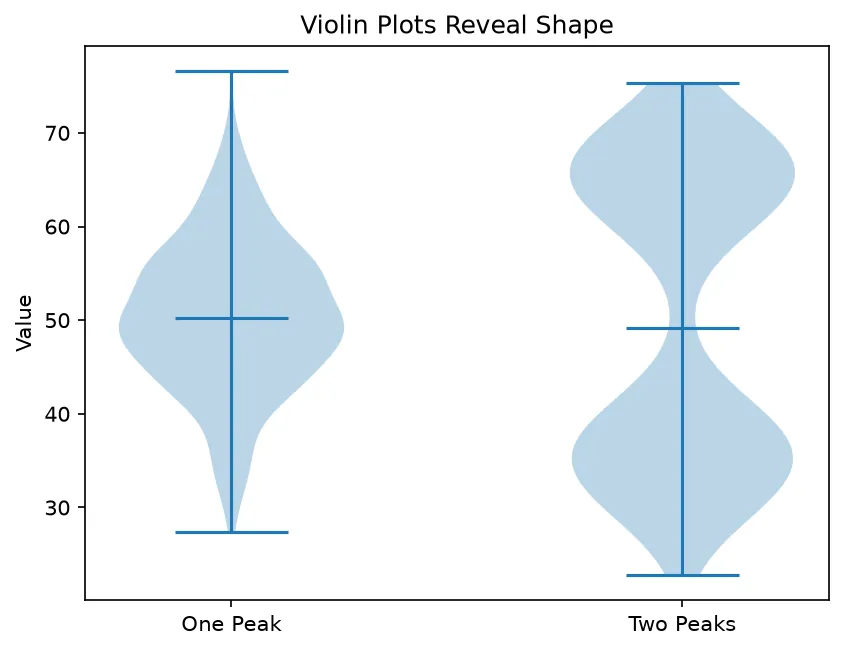
What you'll see: two violin shapes. The left one bulges in the middle like a single bell, while the right one pinches in the center and bulges at top and bottom — clearly showing two clusters that a box plot alone would have flattened into one box.
🎯 Your Turn: Fill in the Blanks
Replace each ___ to compare two teams with a box plot and hide the outliers.
import matplotlib.pyplot as plt
import numpy as np

rng = np.random.default_rng(1)
team_a = rng.normal(80, 6, 120)
team_b = rng.normal(85, 10, 120)

fig, ax = plt.subplots()

# Draw one box per team, hide outlier dots
ax.___([team_a, team_b],
       tick_labels=["Team A", "Team B"],
       showfliers=___)

# Label the y-axis
ax.___("Productivity Score")

plt.show()
📋 Common Errors & Quick Reference
❌ Only one box appears for many groups
You passed a flat array instead of a list of arrays. Wrap your groups in a list: ax.boxplot([a, b, c]), not ax.boxplot(a, b, c).
Newer Matplotlib renamed the argument. Use tick_labels=[...] for box plots instead of labels=[...].
❌ Violin labels land on the wrong boxes
ax.violinplot() doesn't take labels. Set them yourself with ax.set_xticks([1, 2]) then ax.set_xticklabels([...]).
| Call | What It Does |
|---|---|
| ax.boxplot([a, b]) | One box per array |
| tick_labels=[...] | Name each box |
| notch=True | Pinch box around median |
| showfliers=False | Hide outlier dots |
| ax.violinplot(..., showmedians=True) | Density curve with median |
🎯 Mini-Challenge: Commute Times
Compare morning commute times across three transit modes with a horizontal box plot, then add a violin plot beside it on a second axis.
import matplotlib.pyplot as plt
import numpy as np

rng = np.random.default_rng(99)
bus   = rng.normal(35, 8, 150)
train = rng.normal(28, 4, 150)
bike  = rng.normal(40, 12, 150)
data = [bus, train, bike]
names = ["Bus", "Train", "Bike"]

fig, (ax1, ax2) = plt.subplots(1, 2, figsize=(11, 4))

# Left: horizontal box plot
ax1.boxplot(data, tick_labels=names, orientation="horizontal", showfliers=False)
ax1.set_title("Box Plot")
ax1.set_xlabel("Minutes")

# Right: violin plot of the same data
ax2.violinplot(data, showmedians=True)
ax2.set_xticks([1, 2, 3])
ax2.set_xticklabels(names)
ax2.set_title("Violin Plot")
ax2.set_ylabel("Minutes")

fig.suptitle("Morning Commute Times by Mode")
plt.tight_layout()
plt.show()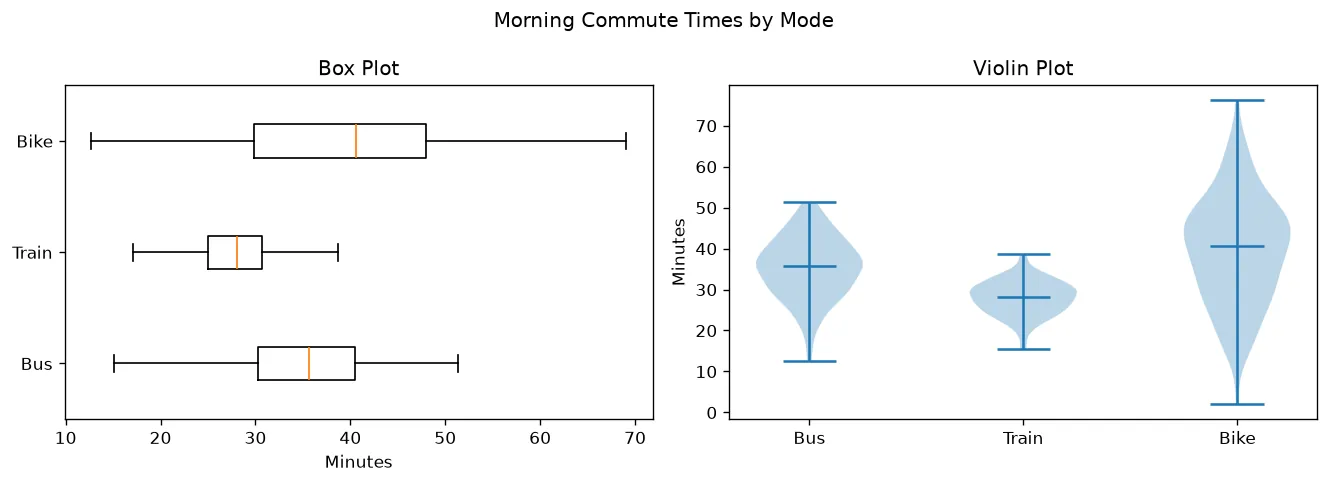
import matplotlib.pyplot as plt

morning = [12, 15, 14, 18, 40, 13, 16]
evening = [22, 25, 24, 28, 21, 26, 23]

fig, ax = plt.subplots()
bp = ax.boxplot([morning, evening])
# set_xticks rather than boxplot's own label argument, which was renamed
# from labels= to tick_labels= in matplotlib 3.9 — this works on both.
ax.set_xticks([1, 2], labels=["morning", "evening"])

print("Boxes:", len(bp["boxes"]))
print("Whisker pairs:", len(bp["whiskers"]) // 2)
print("Outliers marked:", sum(len(f.get_ydata()) for f in bp["fliers"]))
print("Morning median:", sorted(morning)[len(morning) // 2])
print("Evening median:", sorted(evening)[len(evening) // 2])
print("Tick labels:", [t.get_text() for t in ax.get_xticklabels()])

# ✅ Expected output:
# Boxes: 2
# Whisker pairs: 2
# Outliers marked: 1
# Morning median: 15
# Evening median: 24
# Tick labels: ['morning', 'evening']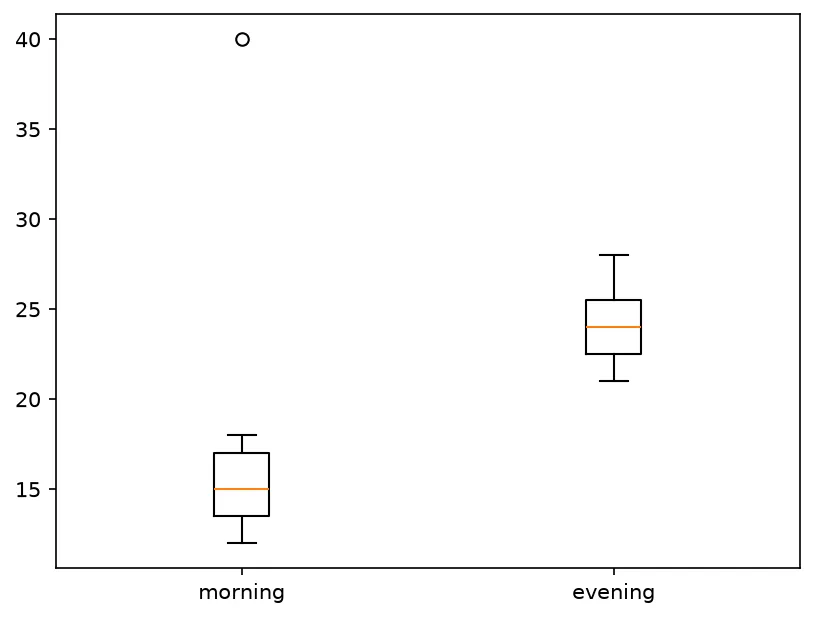
❓ Frequently Asked Questions
Lesson complete — you can summarize distributions!
You drew single and grouped box plots, read the median, quartiles, and outliers, tuned the notch and flier options, and switched to violin plots to expose the shape of your data.
Practice quiz
Which method draws a box plot?
- ax.boxplot()
- ax.box()
- ax.whisker()
- ax.quartile()
Answer: ax.boxplot(). ax.boxplot() draws the five-number-summary box plot.
What does the line inside the box mark?
- The mean
- The median
- The maximum
- The first quartile
Answer: The median. The line inside the box marks the median (the middle value).
The box of a box plot spans which range?
- min to max
- mean plus or minus one standard deviation
- Q1 to Q3 (the interquartile range)
- the 5th to 95th percentile
Answer: Q1 to Q3 (the interquartile range). The box runs from the first quartile (Q1) to the third quartile (Q3).
How do you draw one box per group from several arrays?
- Call boxplot once per array
- Pass them as separate positional args
- Use ax.violinplot only
- Pass a list of arrays to ax.boxplot()
Answer: Pass a list of arrays to ax.boxplot(). ax.boxplot([a, b, c]) draws one box per array in the list.
Which argument hides the outlier dots in ax.boxplot()?
- showfliers=False
- notch=False
- outliers=None
- hideoutliers=True
Answer: showfliers=False. showfliers=False hides the individual outlier markers (fliers).
In Matplotlib 3.9+, which argument names each box?
- names
- tick_labels
- categories
- xlabels
Answer: tick_labels. tick_labels names each box (older versions used labels).
What does a violin plot add that a box plot does not show?
- The exact median value
- The number of points
- A smoothed density curve revealing shape
- The axis labels
Answer: A smoothed density curve revealing shape. A violin plot draws a mirrored density curve, exposing the distribution's shape.
Which method draws a violin plot?
- ax.density()
- ax.shape()
- ax.kde()
- ax.violinplot()
Answer: ax.violinplot(). ax.violinplot() draws violin plots.
What do the dots beyond the whiskers represent?
- Outliers (fliers) past 1.5x the IQR
- The medians
- The means
- Grid lines
Answer: Outliers (fliers) past 1.5x the IQR. Those fliers are outliers more than 1.5x the IQR beyond the box.
Since ax.violinplot() takes no labels argument, how do you name the violins?
- Pass labels= to violinplot
- set_xticks then set_xticklabels
- Use tick_labels=
- Add a legend automatically
Answer: set_xticks then set_xticklabels. Set positions with ax.set_xticks([1,2]) then ax.set_xticklabels([...]).
Continue this course
- Previous: Customizing with rcParams
- Next: Grouped & Stacked Bar Charts — Compare categories side-by-side or stacked, with value labels
- Quick reference: Matplotlib cheat sheet › Plot Types
Frequently asked questions
What is the difference between a box plot and a violin plot?
A box plot summarizes a distribution with five numbers — the minimum, first quartile, median, third quartile, and maximum — drawn as a box with whiskers. A violin plot shows the same idea but adds a smoothed density curve on each side, so you can also see whether the data is bunched up, spread out, or has two peaks. Box plots are compact and precise; violin plots reveal shape.
How do I draw box plots for several groups at once?
Pass a list of arrays to ax.boxplot(). Each array becomes its own box positioned along the x-axis. Set the tick labels with the tick_labels argument (or labels in older Matplotlib) so each box is named. This makes it easy to compare distributions side by side.
What do the dots beyond the whiskers mean?
Those dots are outliers — points that fall more than 1.5 times the interquartile range beyond the box. Matplotlib draws them as individual markers called fliers. You can hide them by passing showfliers=False to ax.boxplot() if they clutter the chart.
When should I use a box or violin plot instead of a histogram?
Reach for a box or violin plot when you want to compare the distributions of several groups in one figure. A histogram shows one group in detail, but stacking many histograms gets messy. Box and violin plots place each group's summary side by side, so differences in median and spread jump out instantly.