Grouped & Stacked Bar Charts
Reviewed & published by Brayan K
Grouped and stacked bar charts plot several data series in one figure — grouped bars sit side by side to compare series within each category, while stacked bars sit on top of each other to show how a total breaks into parts.
Part of the free Matplotlib course at LearnCodingFast — hands-on lessons with worked examples and the output they print, plus practice exercises and a quick quiz.
In this lesson you'll offset bar positions with numpy, stack series with the bottom argument, add a legend, and label every bar using ax.bar_label().
What You'll Learn in This Lesson
- Building x positions with np.arange()
- Offsetting bars to draw them side by side
- Stacking series with the bottom= argument
- Adding a legend to tell series apart
- Labeling bars with ax.bar_label()
- Choosing grouped vs stacked layouts
1 Grouped Bars: Offsetting Positions
To place two series side by side, you can't reuse the same x positions — the bars would land on top of each other. Instead, build a numeric position array with np.arange(), then shift one series left and the other right by half the bar width. The category labels are added afterward with ax.set_xticks() and ax.set_xticklabels().
import matplotlib.pyplot as plt
import numpy as np

quarters = ["Q1", "Q2", "Q3", "Q4"]
online = [120, 150, 130, 170]
store  = [90, 110, 105, 140]

x = np.arange(len(quarters))   # 0, 1, 2, 3
width = 0.4

fig, ax = plt.subplots()
ax.bar(x - width/2, online, width, label="Online")
ax.bar(x + width/2, store,  width, label="In-Store")

ax.set_xticks(x)
ax.set_xticklabels(quarters)
ax.set_ylabel("Sales (k)")
ax.set_title("Sales by Channel")
ax.legend()

plt.show()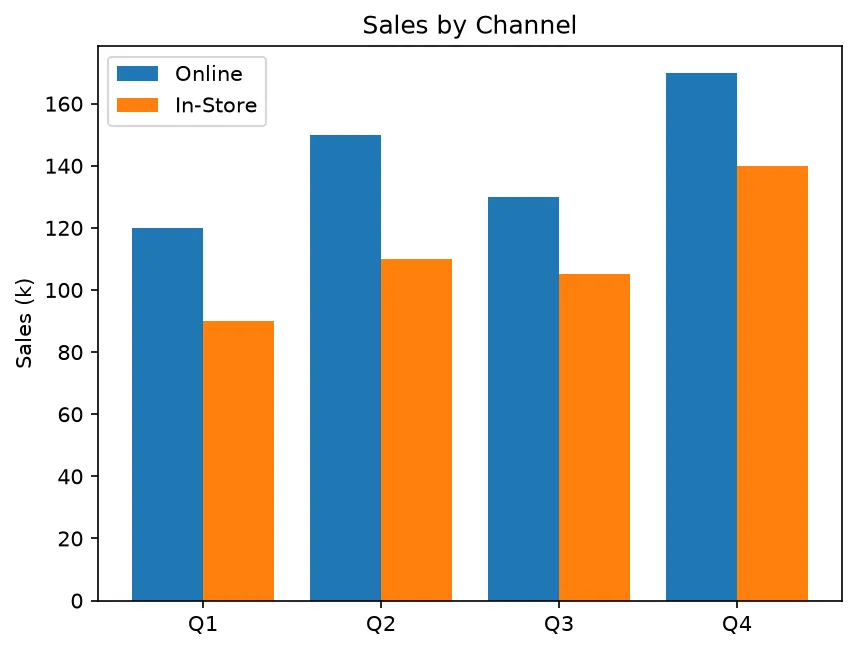
What you'll see: four pairs of bars, one pair per quarter. The Online bar sits just left of center and In-Store just right, both growing toward Q4. The legend in the corner maps each color to a sales channel so you can compare them quarter by quarter.
2 Stacked Bars With bottom=
Stacked bars share the same x position but sit on top of one another. The trick is the bottom argument: it tells each layer where to start. Draw the first series normally, then draw the second with bottom=first. For a third layer, set bottom to the running total. Because numpy arrays add element-wise, first + second gives you that total in one line.
import matplotlib.pyplot as plt
import numpy as np

months = ["Jan", "Feb", "Mar", "Apr"]
rent     = np.array([1200, 1200, 1200, 1200])
food     = np.array([400, 450, 380, 500])
fun      = np.array([200, 300, 250, 350])

fig, ax = plt.subplots()
ax.bar(months, rent, label="Rent")
ax.bar(months, food, bottom=rent, label="Food")
ax.bar(months, fun,  bottom=rent + food, label="Fun")

ax.set_ylabel("Spending ($)")
ax.set_title("Monthly Budget Breakdown")
ax.legend()

plt.show()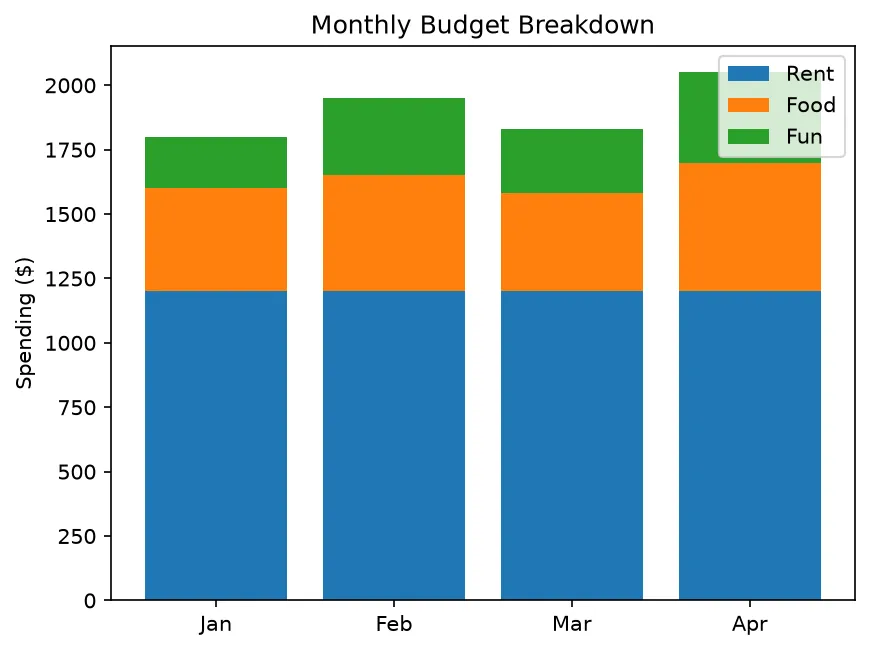
What you'll see: four tall bars, one per month, each split into three colored segments. Rent forms a steady base, Food sits on top of it, and Fun caps each bar. The full height shows total spending, while the colored bands reveal how that total splits across categories.
3 Value Labels With ax.bar_label()
Modern Matplotlib makes labeling painless. Capture the bars returned by ax.bar(), then pass that object to ax.bar_label(). It writes each bar's height just above it. For stacked charts, add label_type="center" to drop the number inside each segment.
import matplotlib.pyplot as plt
import numpy as np

teams = ["Alpha", "Beta", "Gamma"]
won  = np.array([14, 9, 11])
lost = np.array([6, 11, 9])

fig, ax = plt.subplots()
b1 = ax.bar(teams, won, label="Won")
b2 = ax.bar(teams, lost, bottom=won, label="Lost")

# Number inside each segment, total above
ax.bar_label(b1, label_type="center")
ax.bar_label(b2, label_type="center")
ax.bar_label(b2)   # grand total on top

ax.set_ylabel("Games")
ax.set_title("Season Record by Team")
ax.legend()

plt.show()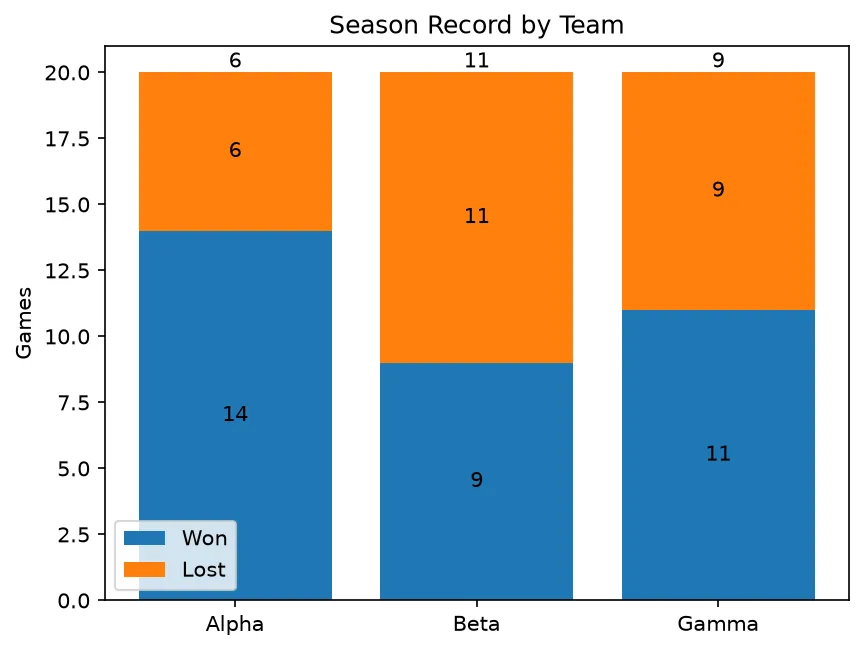
What you'll see: three stacked bars showing wins and losses per team. The win count sits centered in the lower segment, the loss count centered in the upper one, and the season total floats just above each bar — no manual text positioning required.
🎯 Your Turn: Fill in the Blanks
Replace each ___ to draw two series side by side and label one of them.
import matplotlib.pyplot as plt
import numpy as np

days = ["Mon", "Tue", "Wed"]
am = [20, 25, 18]
pm = [30, 28, 35]

# Build numeric positions and a bar width
x = np.___(len(days))
width = 0.4

fig, ax = plt.subplots()
# Shift AM left, PM right
ax.bar(x - width/2, am, width, label="AM")
bars = ax.bar(x ___ width/2, pm, width, label="PM")

ax.set_xticks(x)
ax.set_xticklabels(days)

# Put the value above each PM bar
ax.___(bars)
ax.legend()

plt.show()
📋 Common Errors & Quick Reference
❌ Bars land on top of each other
You drew both series at the same x. Offset them: x - width/2 and x + width/2 with a width below 0.5.
❌ Stacked layers overlap instead of stacking
You forgot bottom=. Each higher layer needs bottom set to the running total below it.
❌ TypeError when adding lists for bottom=
Plain lists concatenate, not add. Wrap your data in np.array(...) so a + b adds element-wise.
| Call | What It Does |
|---|---|
| np.arange(n) | Numeric positions 0..n-1 |
| ax.bar(x - w/2, a, w) | One offset series of a group |
| ax.bar(x, b, bottom=a) | Stack b on top of a |
| ax.bar_label(bars) | Auto-label each bar |
| label_type="center" | Put label inside the bar |
🎯 Mini-Challenge: Three-Series Grouped Bars
Plot survey results for three answers across four products as grouped bars, label every bar, and add a legend.
import matplotlib.pyplot as plt
import numpy as np

products = ["A", "B", "C", "D"]
love = [40, 35, 50, 30]
ok   = [30, 40, 25, 45]
hate = [10, 15, 12, 20]

x = np.arange(len(products))
width = 0.25

fig, ax = plt.subplots(figsize=(9, 5))
b1 = ax.bar(x - width, love, width, label="Love it")
b2 = ax.bar(x,         ok,   width, label="It's OK")
b3 = ax.bar(x + width, hate, width, label="Hate it")

ax.set_xticks(x)
ax.set_xticklabels(products)
ax.set_ylabel("Responses")
ax.set_title("Survey Results by Product")
ax.legend()

for bars in (b1, b2, b3):
    ax.bar_label(bars, padding=2, fontsize=8)

plt.tight_layout()
plt.show()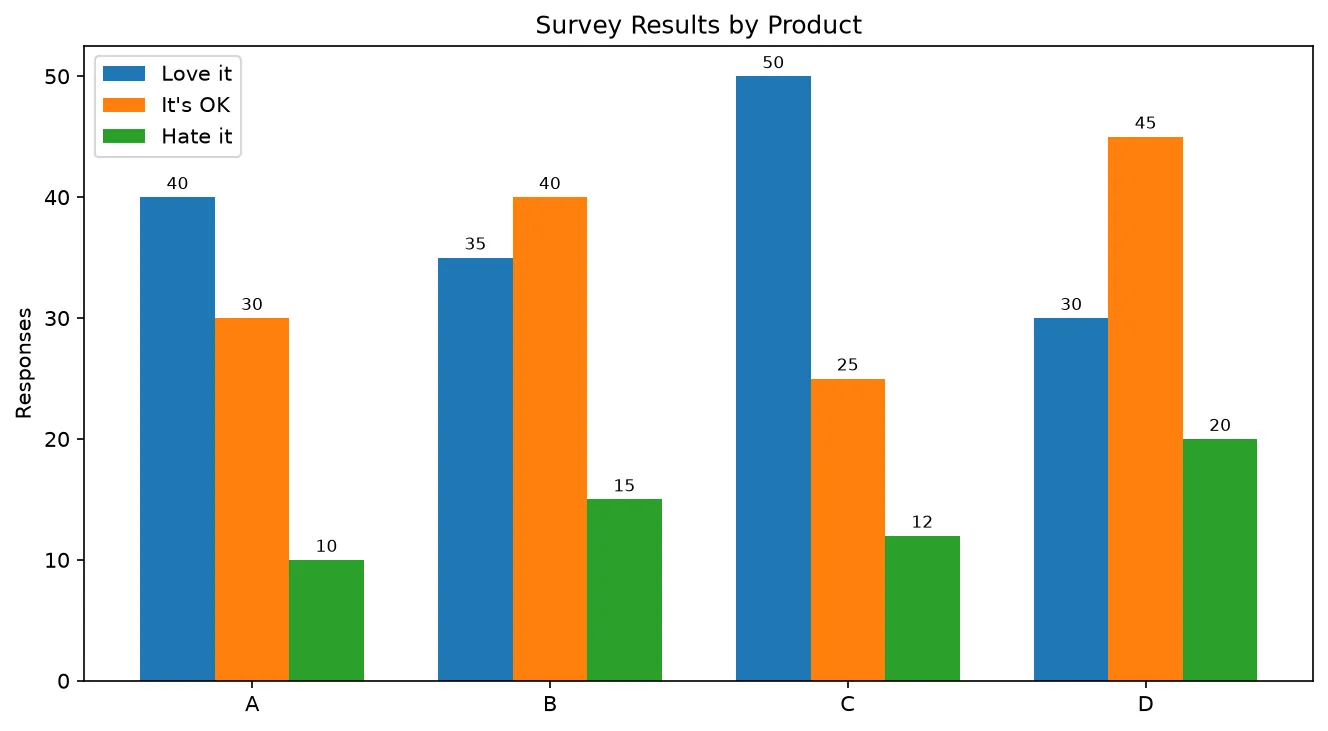
import matplotlib.pyplot as plt

teams = ["A", "B", "C"]
won = [5, 3, 7]
lost = [2, 4, 1]
width = 0.35
pos = range(len(teams))

fig, ax = plt.subplots()
b1 = ax.bar([p - width / 2 for p in pos], won, width, label="won")
b2 = ax.bar([p + width / 2 for p in pos], lost, width, label="lost")
ax.set_xticks(list(pos), labels=teams)
ax.legend()

print("Bars in total:", len(ax.patches))
print("Won heights:", [int(b.get_height()) for b in b1])
print("Lost heights:", [int(b.get_height()) for b in b2])
print("Bar width:", b1[0].get_width())
print("Groups do not overlap:", width * 2 <= 1.0)
print("Played per team:", [w + l for w, l in zip(won, lost)])

# ✅ Expected output:
# Bars in total: 6
# Won heights: [5, 3, 7]
# Lost heights: [2, 4, 1]
# Bar width: 0.35
# Groups do not overlap: True
# Played per team: [7, 7, 8]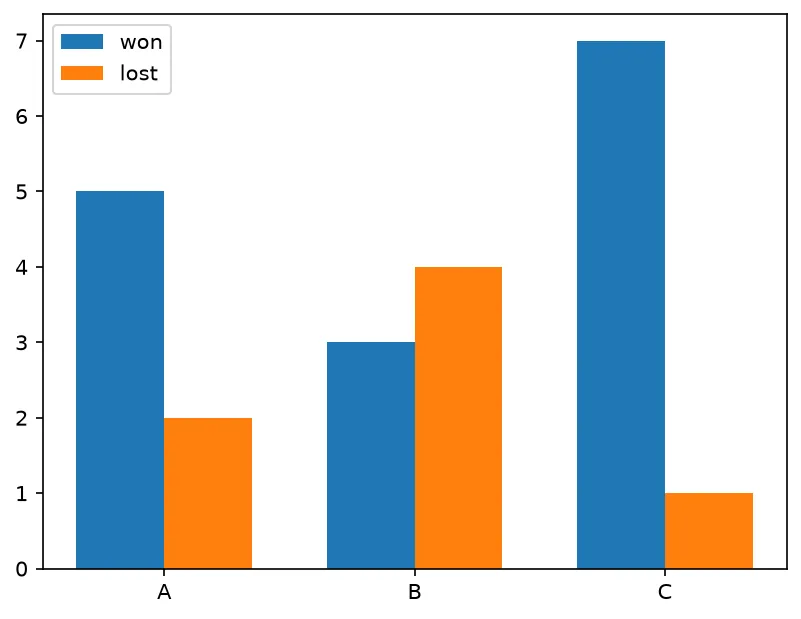
❓ Frequently Asked Questions
Lesson complete — you can plot multiple series in one chart!
You offset positions with numpy to draw grouped bars, stacked series with the bottom argument, added legends, and labeled every bar automatically with ax.bar_label().
Practice quiz
To draw two series side by side, you first build numeric positions with...
- np.zeros()
- np.arange(len(categories))
- range(0)
- np.fill()
Answer: np.arange(len(categories)). np.arange(len(categories)) gives positions 0, 1, 2, ... to offset bars from.
How do you offset two grouped bars around each position x with width w?
- x and x
- x - w/2 and x + w/2
- x*2 and x/2
- x + w and x + w
Answer: x - w/2 and x + w/2. Draw one series at x - width/2 and the other at x + width/2 so they sit side by side.
Which argument stacks one bar series on top of another?
- stack=True
- top=
- bottom=
- base=
Answer: bottom=. bottom= tells each layer where to start, stacking it on the series below.
For a third stacked layer, what should bottom be set to?
- 0
- Just the first layer
- The running total of the layers below
- The largest value
Answer: The running total of the layers below. Set bottom to the running total (layer1 + layer2) so the third layer sits on top.
Why use np.array instead of plain lists for stacked data?
- Lists are slower to plot
- Arrays add element-wise; lists would concatenate
- Arrays are required by ax.bar()
- Lists cannot hold numbers
Answer: Arrays add element-wise; lists would concatenate. np.array lets rent + food add element-wise; plain lists would concatenate instead.
Which method automatically labels each bar with its value?
- ax.bar_label(bars)
- ax.annotate_all()
- ax.label_bars()
- ax.text_bars()
Answer: ax.bar_label(bars). ax.bar_label(bars) writes each bar's height just above it.
What does label_type='center' do in ax.bar_label()?
- Centers the chart
- Puts the label inside the bar
- Centers the legend
- Removes the label
Answer: Puts the label inside the bar. label_type='center' drops the value inside each bar, handy for stacked charts.
After offsetting grouped bars, how do you restore the category names on the x-axis?
- ax.set_xticks(x) then ax.set_xticklabels(categories)
- ax.rename(categories)
- ax.categories = ...
- ax.set_labels()
Answer: ax.set_xticks(x) then ax.set_xticklabels(categories). Set the ticks to x, then set their labels to the category names.
Which keeps grouped bars from touching for two bars per group?
- width above 1.0
- width of 0.4 (group total under 1.0)
- width of 1.5
- width of 0
Answer: width of 0.4 (group total under 1.0). Keep the group's total width under 1.0; for two bars a width of 0.4 leaves a clean gap.
When should you choose STACKED bars over grouped bars?
- To compare series against each other in each category
- To show a total and how it breaks into parts
- To plot a single series
- To show uncertainty
Answer: To show a total and how it breaks into parts. Stacked bars show each category's total and its breakdown; grouped bars compare series.
Continue this course
- Previous: Box & Violin Plots
- Next: Error Bars & Confidence Bands — Show uncertainty with errorbar and shaded confidence bands
- Quick reference: Matplotlib cheat sheet
Frequently asked questions
How do I put bars side by side instead of on top of each other?
Create a numeric position array with numpy's arange, then draw each series at a shifted position. Offset the first series left by half a bar width and the second right by half a bar width: ax.bar(x - width/2, series_a, width) and ax.bar(x + width/2, series_b, width). Finally set the category names with ax.set_xticks(x) and ax.set_xticklabels(labels).
What does the bottom= argument do in ax.bar()?
bottom= tells Matplotlib where the base of each bar should start. For a stacked chart you draw the first series normally, then draw the second series with bottom set to the first series' values so it stacks on top. Add a running total for each additional layer.
How do I label each bar with its value automatically?
Use ax.bar_label(bars) where bars is the object returned by ax.bar(). Matplotlib places the height of each bar just above it. You can pass label_type='center' to put the label inside the bar, which is handy for stacked charts.
When should I use grouped bars versus stacked bars?
Use grouped bars when you want to compare individual series against each other category by category. Use stacked bars when you care about the total of each category and how it breaks down into parts. Grouped answers 'which series is biggest here?'; stacked answers 'what's the total, and how is it split?'.