Error Bars & Confidence Bands
Reviewed & published by Brayan K
An error bar is a small line drawn through a data point that shows how much that value could vary, turning a single number into an honest range of uncertainty around your measurement.
Part of the free Matplotlib course at LearnCodingFast — hands-on lessons with worked examples and the output they print, plus practice exercises and a quick quiz.
In this lesson you'll add symmetric and asymmetric error bars with ax.errorbar(), put error bars on a bar chart, and draw a smooth shaded confidence band.
What You'll Learn in This Lesson
- Drawing error bars with ax.errorbar()
- Using yerr, xerr, fmt, and capsize
- Symmetric vs asymmetric error ranges
- Adding error bars to a bar chart
- Drawing a shaded confidence band
- Choosing bars vs a band for uncertainty
1 Your First Error Bars
ax.errorbar() works like ax.plot() but adds an uncertainty range to each point. Pass yerr to draw vertical error bars and xerr for horizontal ones. The fmt argument sets the marker and line style — use "o" for points only or "-o" to connect them. Add capsize to put readable caps on the ends.
import matplotlib.pyplot as plt
import numpy as np

x = np.array([1, 2, 3, 4, 5])
y = np.array([2.1, 3.9, 6.2, 7.8, 10.1])
err = np.array([0.4, 0.6, 0.3, 0.8, 0.5])   # one error per point

fig, ax = plt.subplots()
ax.errorbar(x, y, yerr=err, fmt="-o", capsize=5, color="teal")

ax.set_title("Measurements With Uncertainty")
ax.set_xlabel("Trial")
ax.set_ylabel("Reading")

plt.show()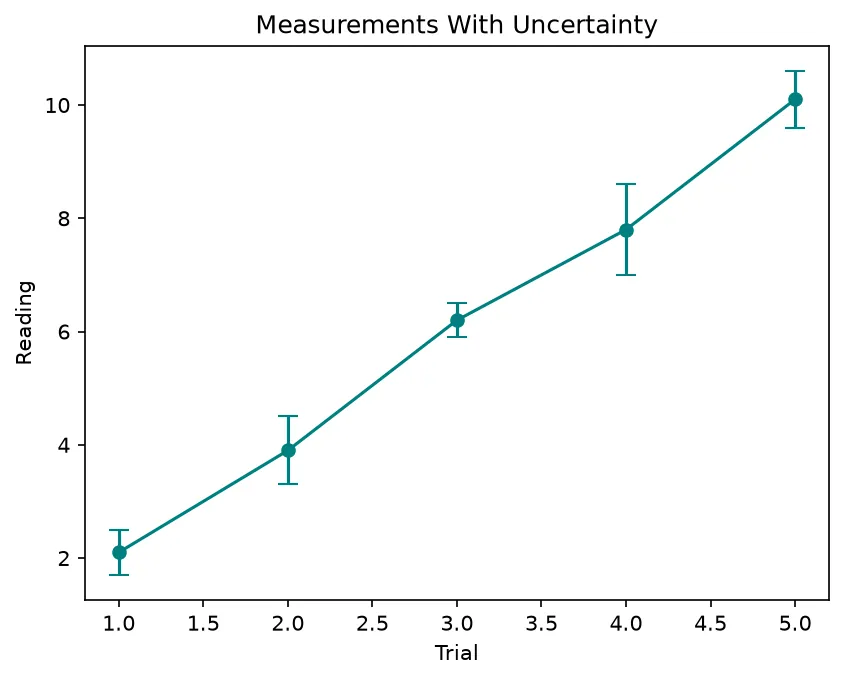
What you'll see: five teal points connected by a line that climbs from left to right. A short vertical bar runs through each point with little caps at its ends — taller bars (like the fourth point) signal more uncertainty in that reading.
2 Asymmetric Errors & Error Bars on Bars
Sometimes a value could be more wrong in one direction than the other. For asymmetric error bars, pass yerr as a two-row array: the first row is the distance below each point and the second is the distance above. You can also attach error bars directly to a bar chart by passing yerr to ax.bar().
import matplotlib.pyplot as plt
import numpy as np

cats = ["Model A", "Model B", "Model C"]
acc = np.array([0.82, 0.88, 0.79])
# Asymmetric: lower row, then upper row
err = np.array([[0.05, 0.03, 0.06],   # how far down
                [0.02, 0.04, 0.03]])  # how far up

fig, ax = plt.subplots()
ax.bar(cats, acc, yerr=err, capsize=6, color="cornflowerblue")

ax.set_title("Model Accuracy With Error Bars")
ax.set_ylabel("Accuracy")
ax.set_ylim(0, 1)

plt.show()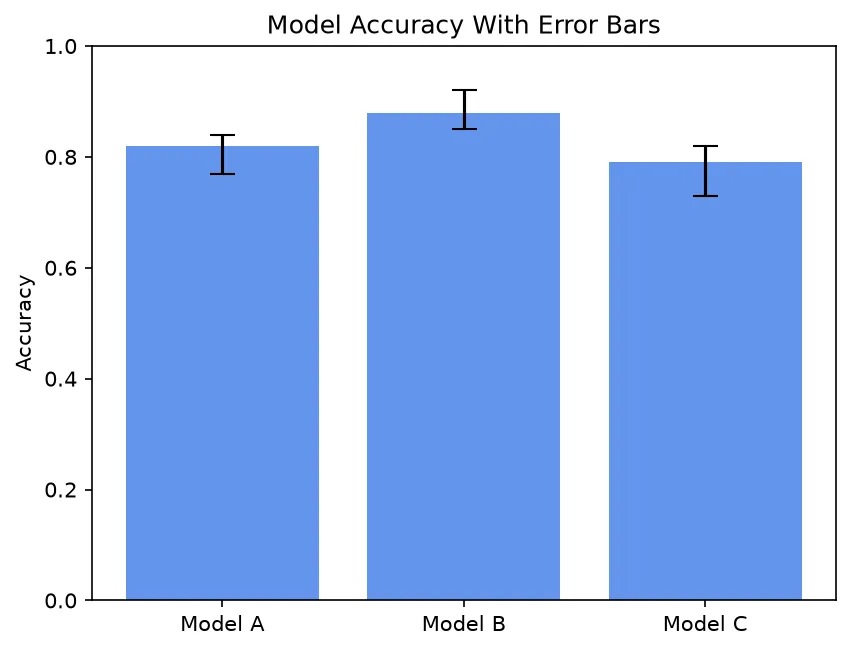
What you'll see: three blue bars showing model accuracy. A thin black error bar rises from the top of each one, and because the errors are asymmetric, the cap above the bar is closer than the cap below it — the downside risk is larger than the upside.
3 Shaded Confidence Bands
When you have a smooth curve with uncertainty at every point, dozens of error bars become noise. Instead, draw the line with ax.plot() and wrap it in a translucent ribbon using ax.fill_between(x, y - err, y + err, alpha=0.3). The band shows the same uncertainty as a continuous shaded region — far cleaner for dense data.
import matplotlib.pyplot as plt
import numpy as np

x = np.linspace(0, 10, 100)
y = np.sin(x) + x / 5
err = 0.2 + 0.1 * np.sqrt(x)   # uncertainty grows with x

fig, ax = plt.subplots()
ax.plot(x, y, color="darkorange", label="Estimate")
ax.fill_between(x, y - err, y + err,
                color="darkorange", alpha=0.25,
                label="95% band")

ax.set_title("Forecast With Confidence Band")
ax.set_xlabel("Time")
ax.set_ylabel("Value")
ax.legend()

plt.show()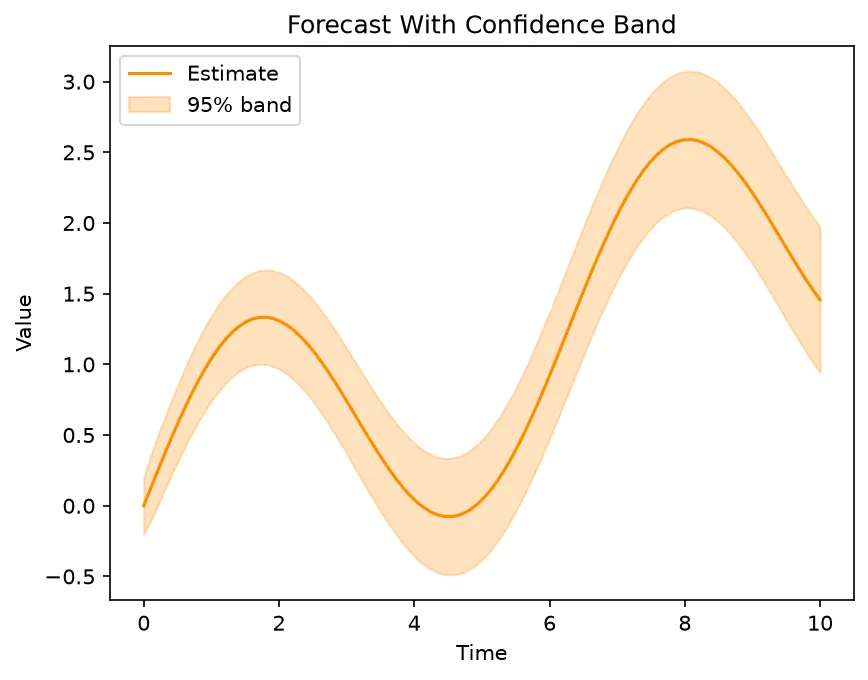
What you'll see: a wavy orange line trending upward, hugged by a soft orange ribbon. The ribbon starts narrow on the left and widens toward the right, visually telling the reader that the forecast grows less certain further out.
🎯 Your Turn: Fill in the Blanks
Replace each ___ to plot points with vertical error bars and end caps.
import matplotlib.pyplot as plt
import numpy as np

x = np.array([1, 2, 3, 4])
y = np.array([5, 7, 6, 9])
err = np.array([0.5, 0.7, 0.4, 0.6])

fig, ax = plt.subplots()

# Draw markers with vertical error bars and caps of size 5
ax.___(x, y, yerr=___, fmt="o", capsize=___)

ax.set_ylabel("Measured value")

plt.show()
📋 Common Errors & Quick Reference
❌ ValueError: shape mismatch on yerr
For asymmetric errors yerr must have shape (2, N) — a lower row and an upper row, each the same length as your data.
The default capsize is 0. Set capsize=4 or higher to make the end caps visible.
❌ Error bars point below zero on a log axis
Negative lower bounds break log scales. Clip the lower error so y - err stays positive before plotting.
| Call | What It Does |
|---|---|
| ax.errorbar(x, y, yerr=e) | Vertical error bars |
| xerr=e | Horizontal error bars |
| yerr=[low, high] | Asymmetric range |
| capsize=5 | Add caps to the ends |
| ax.fill_between(x, lo, hi, alpha=.3) | Shaded confidence band |
🎯 Mini-Challenge: Bars vs Band
Show the same uncertain data two ways: discrete error bars on the left, and a smooth shaded band on the right.
import matplotlib.pyplot as plt
import numpy as np

rng = np.random.default_rng(5)
x = np.linspace(0, 9, 10)
y = 2 + 0.8 * x + rng.normal(0, 0.4, x.size)
err = 0.4 + 0.05 * x

fig, (ax1, ax2) = plt.subplots(1, 2, figsize=(11, 4), sharey=True)

# Left: discrete error bars
ax1.errorbar(x, y, yerr=err, fmt="o", capsize=4, color="purple")
ax1.set_title("Error Bars")
ax1.set_xlabel("x")
ax1.set_ylabel("y")

# Right: continuous shaded band
ax2.plot(x, y, "-", color="purple")
ax2.fill_between(x, y - err, y + err, color="purple", alpha=0.25)
ax2.set_title("Confidence Band")
ax2.set_xlabel("x")

fig.suptitle("Two Ways to Show the Same Uncertainty")
plt.tight_layout()
plt.show()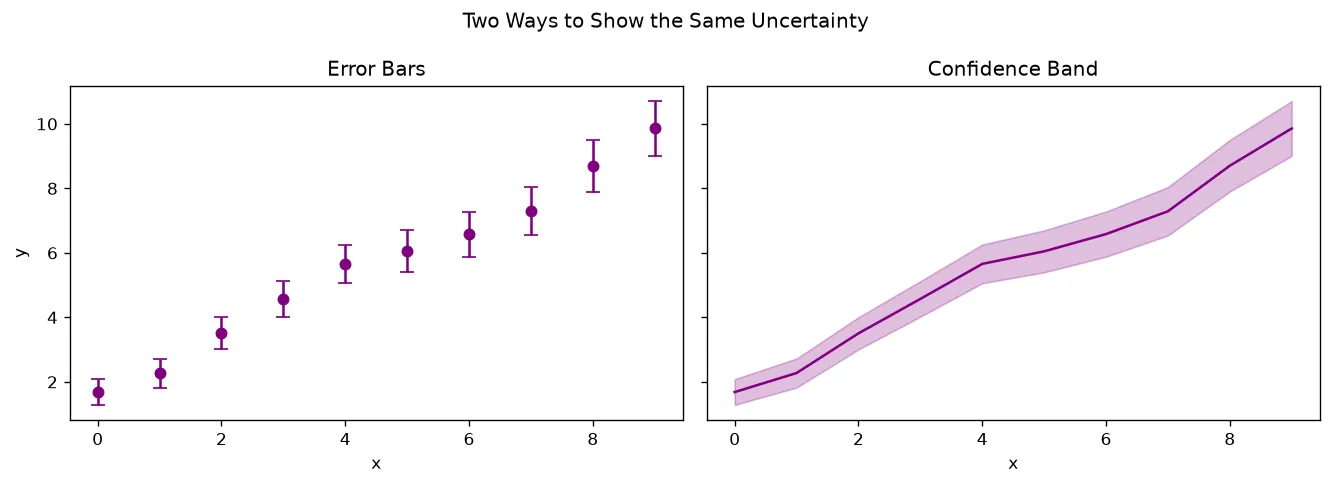
import matplotlib.pyplot as plt

x = [1, 2, 3, 4]
y = [10, 14, 12, 17]
err = [1.0, 2.0, 0.5, 1.5]

fig, ax = plt.subplots()
container = ax.errorbar(x, y, yerr=err, fmt="o-", capsize=4)

line, caps, bars = container
print("Points on the line:", len(line.get_ydata()))
print("Cap lines:", len(caps))
print("Error bar collections:", len(bars))
print("Widest error:", max(err), "at x =", x[err.index(max(err))])
print("Top of the tallest bar:", y[-1] + err[-1])
print("Y axis clears it:", ax.get_ylim()[1] >= y[-1] + err[-1])

# ✅ Expected output:
# Points on the line: 4
# Cap lines: 2
# Error bar collections: 1
# Widest error: 2.0 at x = 2
# Top of the tallest bar: 18.5
# Y axis clears it: True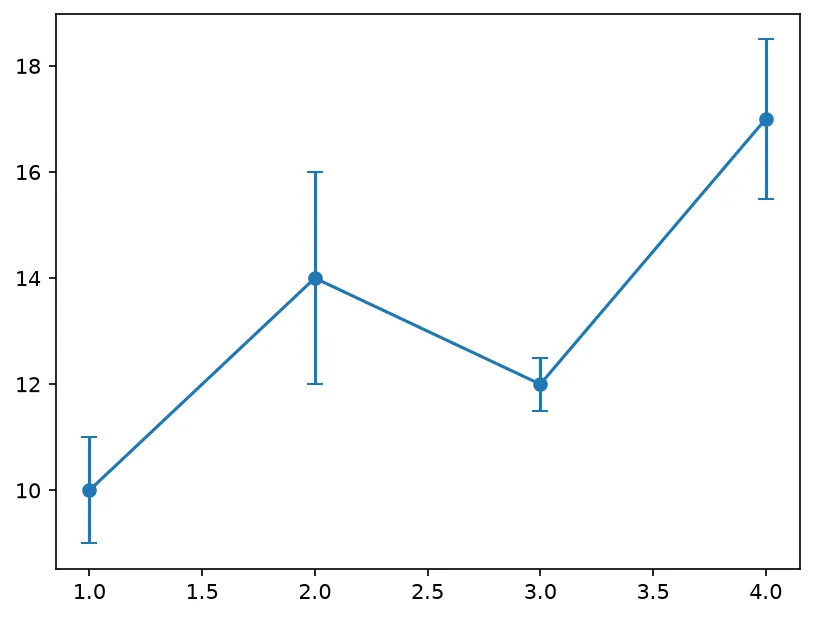
❓ Frequently Asked Questions
Lesson complete — you can show uncertainty honestly!
You drew symmetric and asymmetric error bars with ax.errorbar(), attached error bars to a bar chart, tuned capsize and fmt, and wrapped a smooth line in a shaded confidence band.
Practice quiz
Which Axes method draws data points with vertical uncertainty bars?
- ax.plot()
- ax.errorbar()
- ax.scatter()
- ax.bar()
Answer: ax.errorbar(). ax.errorbar() works like ax.plot() but adds an uncertainty range to each point.
Which argument draws vertical error bars?
- xerr
- yerr
- verr
- barerr
Answer: yerr. yerr draws vertical error bars; xerr draws horizontal ones.
What does the capsize argument control?
- The width of the end caps in points
- The number of points
- The line color
- The marker size
Answer: The width of the end caps in points. capsize sets the width, in points, of the little horizontal caps at the ends of each error bar.
What is the default value of capsize?
- 4
- 5
- 0
- 1
Answer: 0. The default capsize is 0, so no caps appear until you set a positive value.
For asymmetric errors, what shape must yerr have for N points?
- (N,)
- (N, 2)
- (2, N)
- (1, N)
Answer: (2, N). Asymmetric yerr is a (2, N) array: the first row is the lower error, the second the upper.
In a two-row yerr, what does the FIRST row represent?
- The lower (below) error
- The upper (above) error
- The x error
- The mean value
Answer: The lower (below) error. The first row is always the lower error and the second row is the upper error.
What does the fmt argument in ax.errorbar() set?
- The figure size
- The marker and line style
- The axis limits
- The color map
Answer: The marker and line style. fmt sets the marker and line style, just like the format string in ax.plot().
How do you draw a smooth shaded confidence band around a line?
- ax.errorbar()
- ax.bar(yerr=...)
- ax.fill_between(x, y-err, y+err)
- ax.hist()
Answer: ax.fill_between(x, y-err, y+err). ax.fill_between(x, y - err, y + err) shades a continuous ribbon of uncertainty.
Can you attach error bars directly to a bar chart?
- No, never
- Yes, by passing yerr to ax.bar()
- Only with ax.scatter()
- Only with fill_between()
Answer: Yes, by passing yerr to ax.bar(). Passing yerr to ax.bar() draws an error bar rising from each bar.
When is a shaded band preferable to discrete error bars?
- For a handful of discrete points
- For a smooth curve with uncertainty at every x
- Never
- Only for bar charts
Answer: For a smooth curve with uncertainty at every x. A band reads better for a smooth curve with uncertainty at every x; bars suit a few discrete points.
Continue this course
- Previous: Grouped & Stacked Bar Charts
- Next: Filling Areas (fill_between) — Shade regions between curves and build confidence bands
- Quick reference: Matplotlib cheat sheet
Frequently asked questions
How do I add error bars to a line or scatter plot?
Use ax.errorbar(x, y, yerr=errors) instead of ax.plot(). The yerr argument draws a vertical bar above and below each point showing the uncertainty. Add xerr to show horizontal uncertainty too. The fmt argument controls the marker and line style, just like in ax.plot().
What is the difference between symmetric and asymmetric error bars?
Symmetric error bars extend the same amount above and below each point — pass a single array to yerr. Asymmetric error bars can be longer on one side than the other, which is common for skewed data. For those, pass yerr as a two-row array: the first row is the distance below each point and the second is the distance above.
What does capsize do?
capsize sets the width, in points, of the little horizontal caps drawn at the ends of each error bar. A capsize of 0 (the default) gives plain lines with no caps; a value like 4 or 5 adds T-shaped caps that make the ends easier to read.
When should I use a shaded band instead of error bars?
Error bars work well for a handful of discrete points. When you have a smooth curve with uncertainty at every x, a shaded confidence band drawn with fill_between reads better — it shows the uncertainty as a continuous ribbon around the line instead of dozens of overlapping bars.