Filling Areas (fill_between)
Reviewed & published by Brayan K
fill_between is a Matplotlib function that shades the area between a curve and a baseline — or between two curves — making it easy to highlight gaps, ranges, and confidence bands at a glance.
Part of the free Matplotlib course at LearnCodingFast — hands-on lessons with worked examples and the output they print, plus practice exercises and a quick quiz.
In this lesson you'll fill under a curve, shade the region between two lines, use the where argument to fill conditionally, build a confidence band, and flip the fill with fill_betweenx.
What You'll Learn in This Lesson
- Shading under a curve with fill_between()
- Filling the region between two curves
- Controlling transparency with alpha
- Filling conditionally with where=
- Building a confidence band around a line
- Flipping the fill with fill_betweenx()
1 Filling Under a Curve
The simplest use of ax.fill_between() shades the area between a curve and the line y = 0. Pass your x and y arrays and Matplotlib paints everything below the curve. Combine it with a regular ax.plot() on top and a low alpha so the outline stays crisp while the area is softly tinted.
import matplotlib.pyplot as plt
import numpy as np

x = np.linspace(0, 2 * np.pi, 200)
y = np.sin(x)

fig, ax = plt.subplots()
ax.plot(x, y, color="navy")
ax.fill_between(x, y, color="navy", alpha=0.25)

ax.set_title("Area Under a Sine Wave")
ax.set_xlabel("x")
ax.set_ylabel("sin(x)")

plt.show()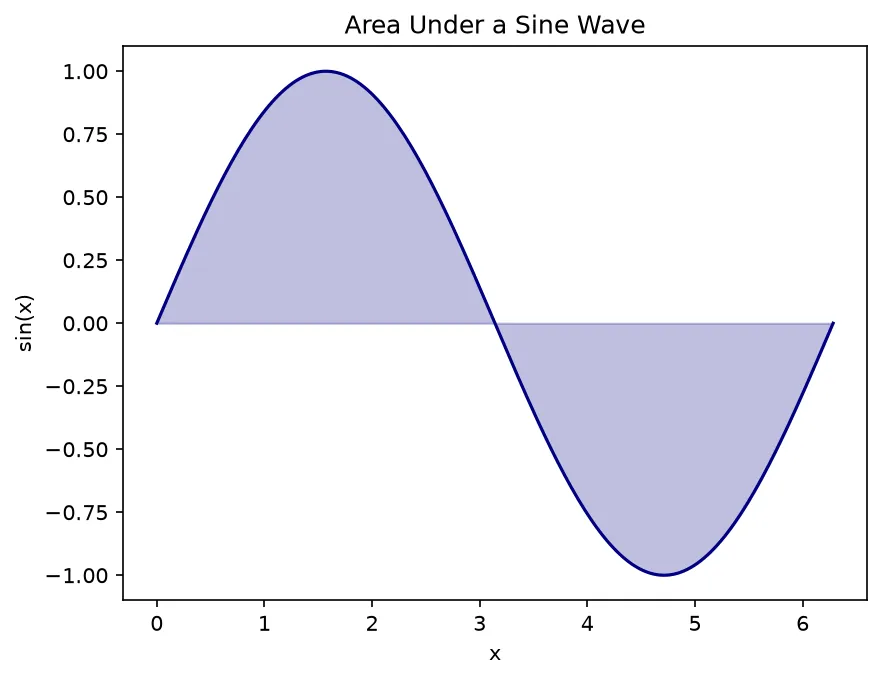
What you'll see: a navy sine wave with the space between it and the x-axis softly tinted. Where the curve dips below zero in the second half, the shading appears below the axis — fill_between follows the curve in both directions.
2 Between Two Curves & Conditional Fills
Pass two y arrays and fill_between shades the gap between them — perfect for showing the spread between a high and a low series. Add the where= argument with a boolean condition to fill only part of the range. A classic example shades green where one curve beats another and red where it loses.
import matplotlib.pyplot as plt
import numpy as np

x = np.linspace(0, 12, 200)
revenue = 50 + 10 * np.sin(x) + x
cost    = 55 + 8 * np.cos(x)

fig, ax = plt.subplots()
ax.plot(x, revenue, label="Revenue", color="black")
ax.plot(x, cost, label="Cost", color="gray")

# Green where we profit, red where we lose
ax.fill_between(x, revenue, cost, where=(revenue >= cost),
                color="green", alpha=0.4, label="Profit")
ax.fill_between(x, revenue, cost, where=(revenue < cost),
                color="red", alpha=0.4, label="Loss")

ax.set_title("Profit vs Loss Zones")
ax.set_xlabel("Week")
ax.legend()

plt.show()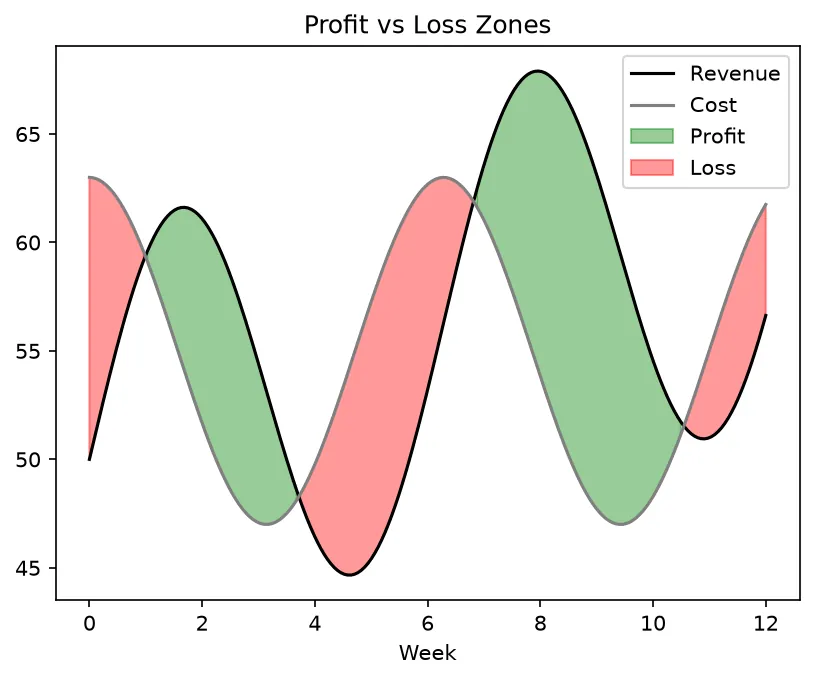
What you'll see: two wavy lines crossing back and forth. Where revenue rises above cost the gap fills green; where it dips below, the gap fills red. The alternating colored patches make profit and loss periods pop out instantly.
3 Confidence Bands & fill_betweenx
A confidence band is just a fill between y - err and y + err wrapped around a line — the same trick we used in the error bars lesson, now in its natural home. And when your independent variable runs up the vertical axis, reach for ax.fill_betweenx(), which shades between two x values across a range of y.
import matplotlib.pyplot as plt
import numpy as np

x = np.linspace(0, 10, 100)
y = np.log1p(x) * 3
err = 0.3 + 0.15 * x

fig, ax = plt.subplots()
ax.plot(x, y, color="crimson", label="Trend")
ax.fill_between(x, y - err, y + err,
                color="crimson", alpha=0.2, label="Uncertainty")

# A vertical highlight band using fill_betweenx
ax.fill_betweenx(y, 4, 6, color="gray", alpha=0.15)

ax.set_title("Confidence Band + Highlighted Region")
ax.set_xlabel("x")
ax.set_ylabel("y")
ax.legend()

plt.show()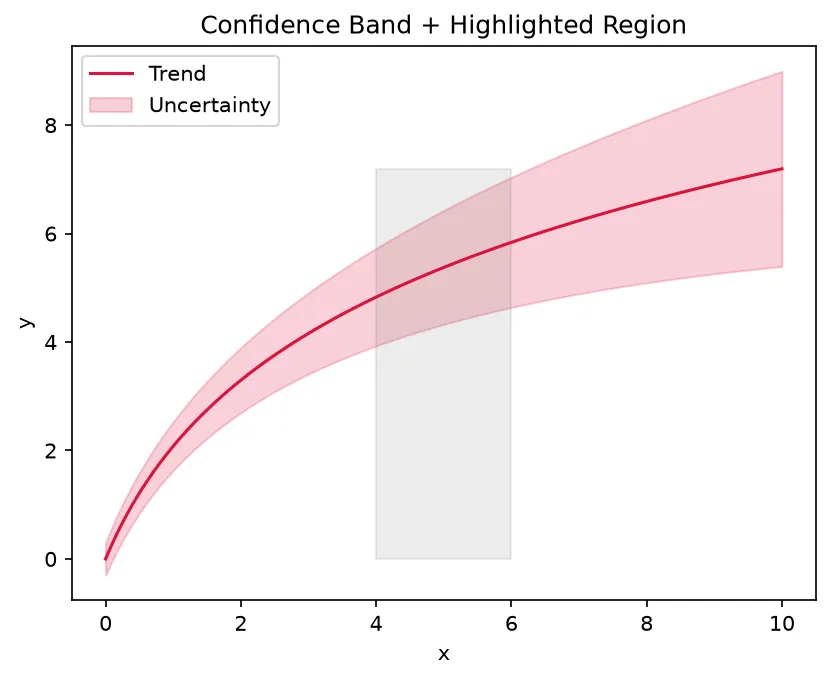
What you'll see: a crimson curve rising and leveling off, hugged by a soft red band that widens to the right. A faint gray vertical stripe between x = 4 and x = 6 (drawn with fill_betweenx) highlights that slice of the plot.
🎯 Your Turn: Fill in the Blanks
Replace each ___ to draw a line and shade a translucent band around it.
import matplotlib.pyplot as plt
import numpy as np

x = np.linspace(0, 6, 60)
y = np.cos(x) + 2
err = 0.3

fig, ax = plt.subplots()
ax.plot(x, y, color="teal")

# Shade between y - err and y + err, semi-transparent
ax.___(x, y - err, y ___ err, color="teal", alpha=___)

ax.set_title("Cosine With a Band")

plt.show()
📋 Common Errors & Quick Reference
❌ The fill hides my line
Draw the fill first or lower its alpha. A solid fill at alpha=1 will paint right over the line.
❌ Gaps appear at the crossing points
When using where=, add interpolate=True so the shaded regions meet exactly where the curves cross.
❌ ValueError: arrays must be the same length
Your x, lower, and upper arrays must all match in length. Build the bounds from the same x.
| Call | What It Does |
|---|---|
| ax.fill_between(x, y) | Fill down to y = 0 |
| ax.fill_between(x, lo, hi) | Fill between two curves |
| where=(a > b) | Fill only where True |
| alpha=0.3 | Make the fill see-through |
| ax.fill_betweenx(y, l, r) | Fill horizontally |
🎯 Mini-Challenge: Temperature Range
Plot the average daily temperature with a shaded band between the daily low and high, and mark the freezing line.
import matplotlib.pyplot as plt
import numpy as np

days = np.arange(1, 31)
avg = 5 + 8 * np.sin(days / 5)
low = avg - 4
high = avg + 4

fig, ax = plt.subplots(figsize=(9, 4))
ax.plot(days, avg, color="darkblue", label="Average")
ax.fill_between(days, low, high, color="skyblue", alpha=0.5,
                label="Low-High range")

# Shade below freezing in light red
ax.fill_between(days, low, 0, where=(low < 0),
                color="red", alpha=0.2, interpolate=True,
                label="Below freezing")
ax.axhline(0, color="gray", linestyle="--", linewidth=1)

ax.set_title("Daily Temperature Range")
ax.set_xlabel("Day")
ax.set_ylabel("Temp (C)")
ax.legend()

plt.tight_layout()
plt.show()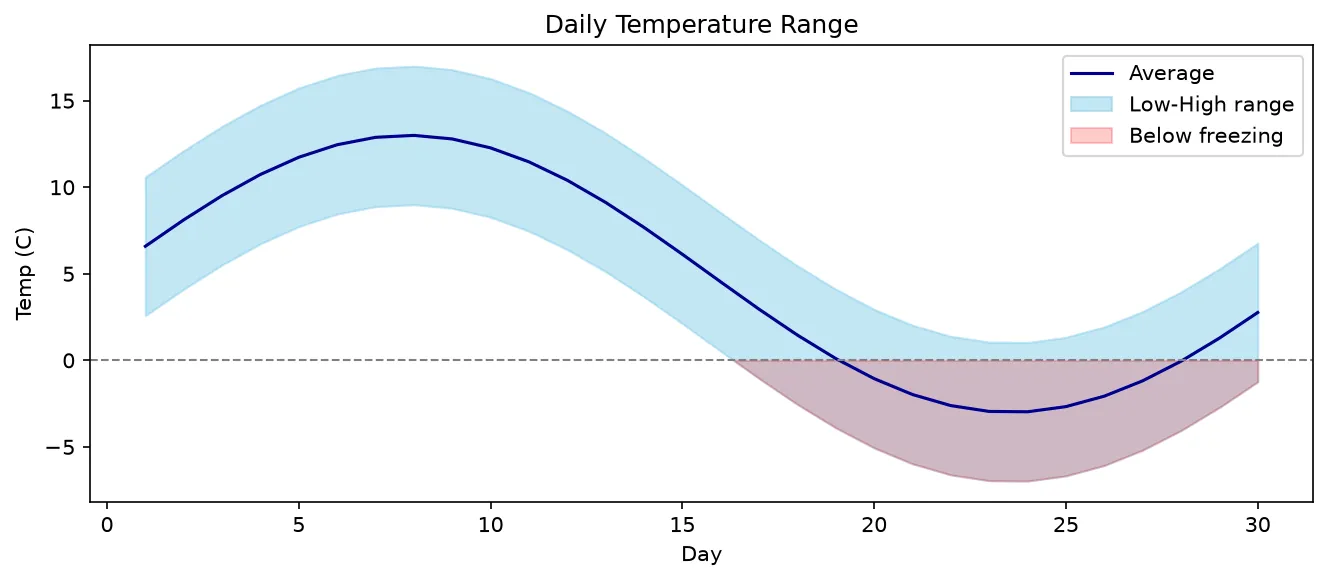
import matplotlib.pyplot as plt

x = [0, 1, 2, 3, 4]
low = [1, 2, 2, 3, 4]
high = [3, 4, 5, 6, 8]

fig, ax = plt.subplots()
band = ax.fill_between(x, low, high, alpha=0.3, color="tab:blue", label="range")
mid = ax.plot(x, [(a + b) / 2 for a, b in zip(low, high)], color="tab:blue", label="middle")
ax.legend()

print("Filled areas:", len(ax.collections))
print("Lines on top:", len(ax.lines))
print("Band label:", band.get_label())
print("Band transparency:", band.get_alpha())
print("Middle values:", [(a + b) / 2 for a, b in zip(low, high)])
print("Legend entries:", [t.get_text() for t in ax.get_legend().get_texts()])

# ✅ Expected output:
# Filled areas: 1
# Lines on top: 1
# Band label: range
# Band transparency: 0.3
# Middle values: [2.0, 3.0, 3.5, 4.5, 6.0]
# Legend entries: ['range', 'middle']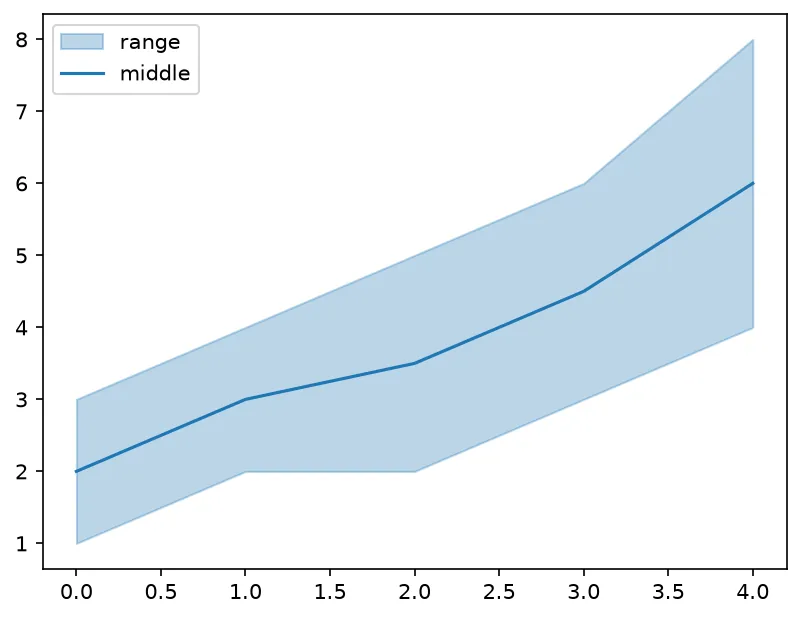
❓ Frequently Asked Questions
Lesson complete — you can shade meaningful regions!
You filled under a curve, shaded between two lines, used where to fill conditionally, built a confidence band, and flipped the fill with fill_betweenx.
Practice quiz
By default, ax.fill_between(x, y) shades the area between the curve and what?
- The top of the figure
- The line y = 0
- The mean of y
- The first data point
Answer: The line y = 0. With a single y array, fill_between shades down to the horizontal line y = 0.
How do you shade the region between two curves?
- ax.fill_between(x, y1, y2)
- ax.fill(x, y1) twice
- ax.plot(x, y1, y2)
- ax.between(y1, y2)
Answer: ax.fill_between(x, y1, y2). Passing two y arrays, fill_between(x, y1, y2), shades the gap between them.
Which argument fills only where a condition is True?
- mask=
- only=
- where=
- cond=
Answer: where=. Pass a boolean array to where= and Matplotlib fills only the True x positions.
How do you make the fill semi-transparent?
- transparent=True
- alpha=0.3
- opacity=0.3
- fade=0.3
Answer: alpha=0.3. alpha takes a value between 0 and 1; lower numbers are more see-through.
What does fill_betweenx do differently from fill_between?
- It fills between two x values across a range of y
- It only fills triangles
- It uses 3D
- It ignores alpha
Answer: It fills between two x values across a range of y. fill_betweenx flips the roles, shading between two x values across a range of y.
Which argument removes gaps at the crossing points of two curves?
- smooth=True
- interpolate=True
- snap=True
- close=True
Answer: interpolate=True. interpolate=True makes the shaded regions meet exactly where the curves cross.
How do you fill between a curve and the line y = 5 (not 0)?
- ax.fill_between(x, y, 5)
- ax.fill_between(x, 5)
- ax.fill_between(x, y, base=5)
- ax.fill_between(x, y, offset=5)
Answer: ax.fill_between(x, y, 5). Pass 5 as the third positional argument to fill down to the line y = 5.
A confidence band around a line is drawn by filling between which bounds?
- 0 and y
- y and 2*y
- y - err and y + err
- min(y) and max(y)
Answer: y - err and y + err. A band is just ax.fill_between(x, y - err, y + err) wrapped around the line.
For where= to work correctly, the x, lower, and upper arrays must be...
- Different lengths
- The same length
- Sorted descending
- Integers only
Answer: The same length. All three arrays must match in length; build the bounds from the same x.
If a solid fill hides your line, a good fix is to...
- Increase alpha to 1
- Lower alpha or draw the fill first
- Remove the line
- Use fill_betweenx
Answer: Lower alpha or draw the fill first. Lower the fill's alpha (or draw it before the line) so the line stays visible.
Continue this course
- Previous: Error Bars & Confidence Bands
- Next: Stem, Step & Stair Plots — Plot discrete signals and step functions
- Quick reference: Matplotlib cheat sheet
Frequently asked questions
What does ax.fill_between() actually fill?
By default ax.fill_between(x, y) shades the area between the curve y and the horizontal line y = 0. If you pass two curves, ax.fill_between(x, y1, y2), it shades the region between them. This is perfect for highlighting a gap, a range, or a confidence band around a line.
How do I shade only part of a curve?
Pass a boolean array to the where= argument. Matplotlib fills only the x positions where the condition is True. For example, where=(y > 0) shades only the parts of the curve above zero, which is great for marking surplus versus deficit.
What is the difference between fill_between and fill_betweenx?
fill_between fills vertically — it shades between two y values across a range of x. fill_betweenx flips the roles: it shades between two x values across a range of y, which is useful when your independent variable runs up the vertical axis.
How do I make the fill semi-transparent so I can still see the line?
Set the alpha argument to a value between 0 and 1, such as alpha=0.3. Lower numbers are more see-through. This lets a solid line and other plot elements show clearly through the shaded region.