Plotting with Dates
Reviewed & published by Brayan K
Matplotlib is a Python library for creating charts and visualizations — and it understands real calendar dates, so a list of datetime objects becomes a properly spaced, neatly labelled time axis.
Part of the free Matplotlib course at LearnCodingFast — hands-on lessons with worked examples and the output they print, plus practice exercises and a quick quiz.
In this lesson you'll build date objects, plot them on the x-axis, format the tick labels with matplotlib.dates, and fix overlapping labels with autofmt_xdate().
What You'll Learn in This Lesson
- Building date objects with datetime
- Plotting dates on the x-axis
- Importing matplotlib.dates as mdates
- Formatting ticks with DateFormatter
- Common strftime codes like %b and %Y
- Fixing overlap with fig.autofmt_xdate()
1 Plotting a List of Dates
Build your dates with Python's datetime module, then pass that list as the x values. Matplotlib recognizes the date objects and lays them out on a proper time axis automatically.
import matplotlib.pyplot as plt
from datetime import date

# A small list of calendar dates
dates = [date(2024, 1, 1), date(2024, 2, 1),
         date(2024, 3, 1), date(2024, 4, 1)]
values = [10, 18, 14, 22]

plt.plot(dates, values, marker='o')
plt.title("Monthly values over time")
plt.xlabel("Date")
plt.ylabel("Value")
plt.show()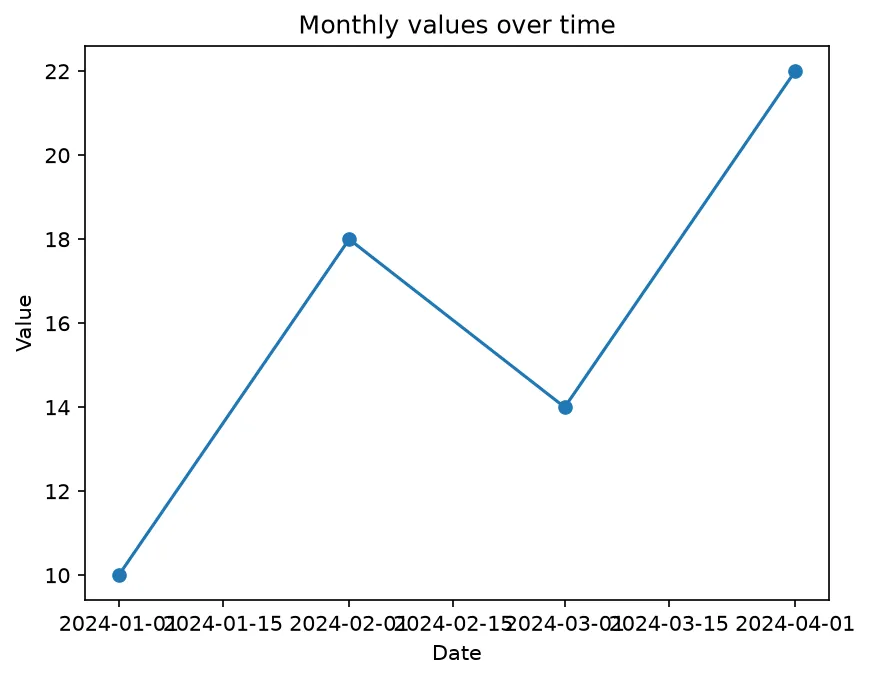
What you'll see: a line rising from January to April, with the four dates correctly spaced along the bottom. Matplotlib spaces them by actual time, not just by position in the list.
2 Formatting Date Labels with mdates
To control how the dates are written, import matplotlib.dates as mdates and attach a DateFormatter to the x-axis. The format string uses the same codes as Python's strftime — for example '%b %Y' renders "Jan 2024".
import matplotlib.pyplot as plt
import matplotlib.dates as mdates
from datetime import date

dates = [date(2024, 1, 15), date(2024, 2, 15),
         date(2024, 3, 15), date(2024, 4, 15),
         date(2024, 5, 15)]
sales = [100, 140, 120, 200, 180]

fig, ax = plt.subplots()
ax.plot(dates, sales, marker='o')

# Show ticks like "Jan 2024", "Feb 2024", ...
ax.xaxis.set_major_formatter(mdates.DateFormatter('%b %Y'))

ax.set_title("Sales by month")
plt.show()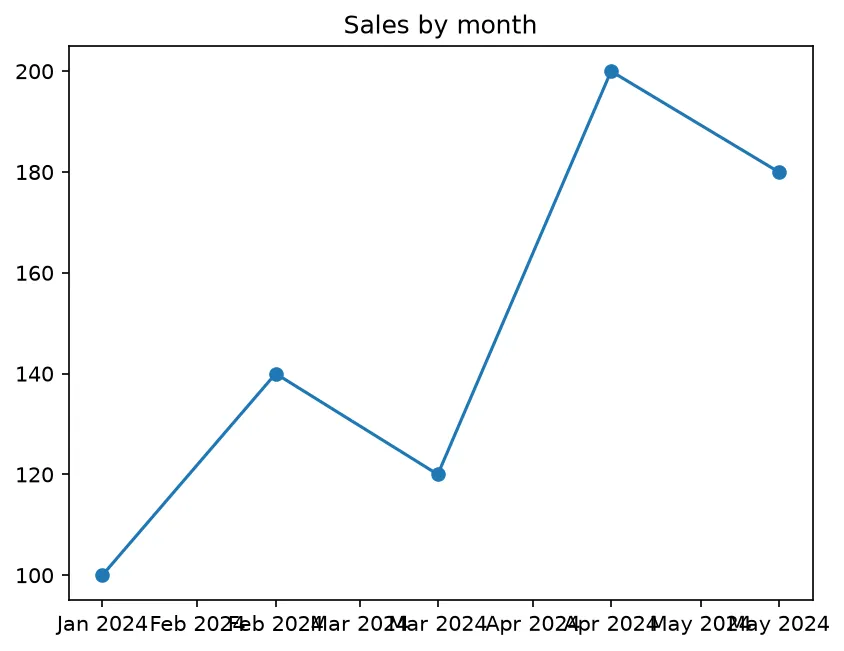
What you'll see: the same trend line, but now the x-axis ticks read "Jan 2024", "Feb 2024", and so on instead of raw numbers — clear, human-readable month labels.
3 Fixing Overlap with autofmt_xdate()
When you have many dates, the labels collide and become unreadable. One call — fig.autofmt_xdate() — rotates and right-aligns the date labels so they fit neatly along the axis.
import matplotlib.pyplot as plt
import matplotlib.dates as mdates
from datetime import date

# Twelve months of data
dates = [date(2024, m, 1) for m in range(1, 13)]
visitors = [120, 150, 170, 200, 240, 300,
            330, 310, 280, 230, 190, 160]

fig, ax = plt.subplots()
ax.plot(dates, visitors, marker='o')
ax.xaxis.set_major_formatter(mdates.DateFormatter('%b %Y'))

# Rotate the date labels so they don't overlap
fig.autofmt_xdate()

ax.set_title("Visitors across the year")
plt.show()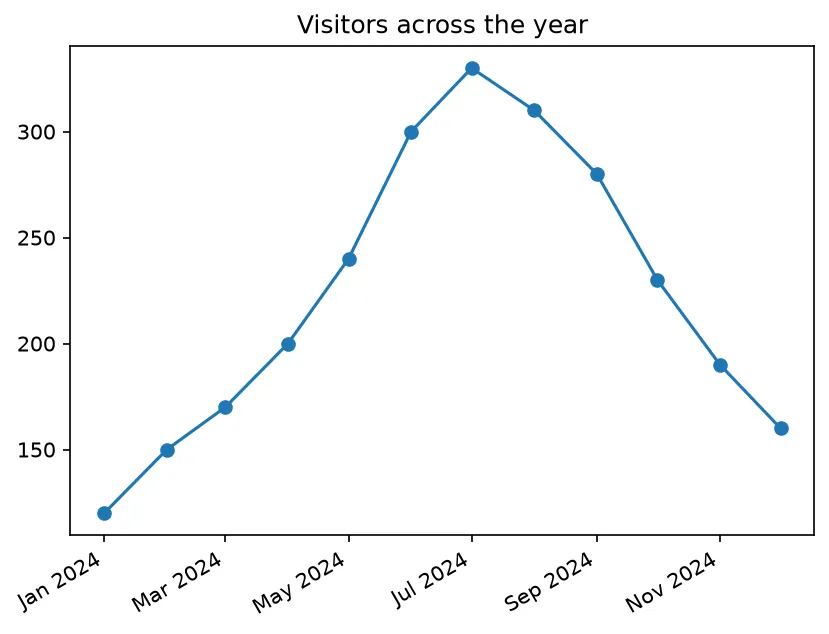
What you'll see: a full-year curve with all twelve month labels tilted at an angle along the bottom, neatly right-aligned so none of them overlap — even though there are many of them.
🎯 Your Turn: Fill in the Blanks
Replace each ___ to plot dates and format them as "Jan 2025".
import matplotlib.pyplot as plt
import matplotlib.dates as ___    # the standard alias
from datetime import date

dates = [date(2025, 1, 1), date(2025, 2, 1), date(2025, 3, 1)]
temps = [5, 8, 12]

fig, ax = plt.subplots()
ax.plot(dates, temps, marker='o')

# Format ticks as short month + year, e.g. "Jan 2025"
ax.xaxis.set_major_formatter(mdates.DateFormatter('___'))

# Rotate the labels
fig.___()

plt.show()
📋 Common Errors & Quick Reference
❌ My dates show as plain numbers
You passed date strings, not date objects. Build them with date(2024, 1, 1) from the datetime module.
❌ The labels overlap badly
Call fig.autofmt_xdate() to rotate them, or use a coarser DateFormatter.
| Call | What It Does |
|---|---|
| from datetime import date | Get the date type |
| import matplotlib.dates as mdates | Date tick tools |
| mdates.DateFormatter('%b %Y') | Label format (e.g. Jan 2024) |
| fig.autofmt_xdate() | Rotate crowded date labels |
🏆 Mini Challenge: A Week of Temperatures
Plot seven daily temperatures, label the axis as "Jun 10" style days, and rotate them.
import matplotlib.pyplot as plt
import matplotlib.dates as mdates
from datetime import date

# A week of dates
days = [date(2025, 6, d) for d in range(10, 17)]
temps = [18, 21, 23, 22, 25, 27, 24]

fig, ax = plt.subplots()
ax.plot(days, temps, marker='o')

# 1. Format ticks as "Jun 10"
ax.xaxis.set_major_formatter(mdates.DateFormatter('%b %d'))

# 2. Rotate the labels
fig.autofmt_xdate()

ax.set_title("Daily temperatures")
plt.show()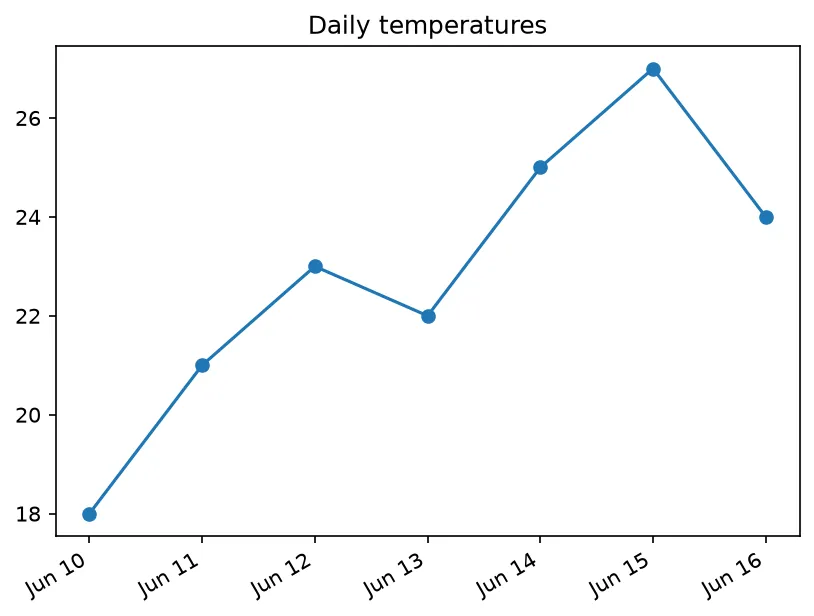
import datetime as dt
import matplotlib.pyplot as plt
import matplotlib.dates as mdates

days = [dt.date(2026, 1, d) for d in (5, 12, 19, 26)]
visits = [120, 145, 132, 178]

fig, ax = plt.subplots()
ax.plot(days, visits, marker="o")
ax.xaxis.set_major_formatter(mdates.DateFormatter("%d %b"))
fig.autofmt_xdate()
fig.canvas.draw()

print("Points:", len(ax.lines[0].get_xdata()))
print("First day:", days[0].isoformat())
print("Last day: ", days[-1].isoformat())
print("Gap between points:", (days[1] - days[0]).days, "days")
print("Formatter:", type(ax.xaxis.get_major_formatter()).__name__)
print("Tick labels:", [t.get_text() for t in ax.get_xticklabels() if t.get_text()][:4])

# ✅ Expected output:
# Points: 4
# First day: 2026-01-05
# Last day:  2026-01-26
# Gap between points: 7 days
# Formatter: DateFormatter
# Tick labels: ['05 Jan', '09 Jan', '13 Jan', '17 Jan']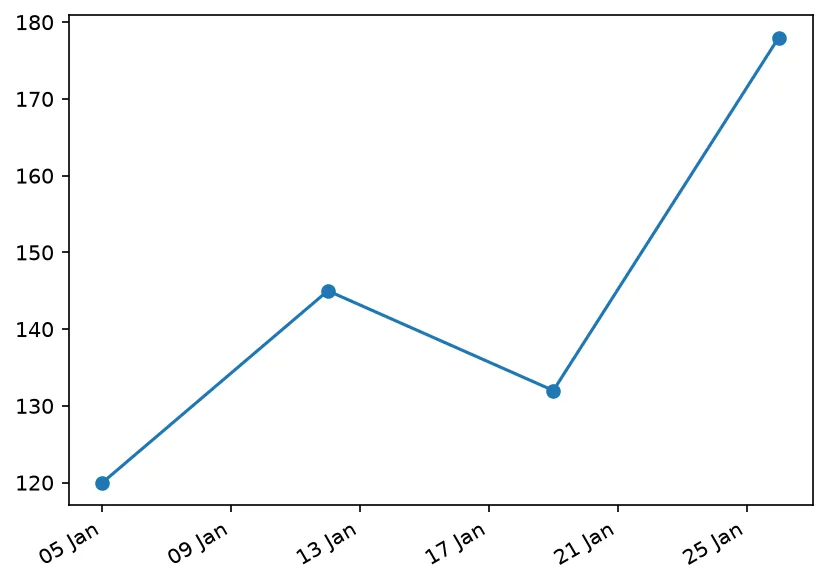
❓ Frequently Asked Questions
Lesson complete — you can plot time itself!
You built date objects, plotted them on a time axis, formatted the ticks with DateFormatter, and tamed crowded labels with autofmt_xdate().
Practice quiz
Can Matplotlib plot Python date objects directly on the x-axis?
- Yes — it recognizes them and spaces them by time
- No, you must convert to strings
- Only with pandas
- Only integers work
Answer: Yes — it recognizes them and spaces them by time. Pass a list of date/datetime objects and Matplotlib lays them out on a time axis.
What is the standard import alias for the date-tools module?
- import matplotlib.dates as dt
- import matplotlib.dates as mdates
- import mdates
- from matplotlib import dates as d
Answer: import matplotlib.dates as mdates. The conventional alias is mdates: import matplotlib.dates as mdates.
Which class formats date tick labels?
- mdates.DateLocator
- mdates.AutoDate
- mdates.DateFormatter
- mdates.TimeAxis
Answer: mdates.DateFormatter. mdates.DateFormatter('%b %Y') controls how dates are written.
Which call attaches a formatter to the x-axis?
- ax.format_xaxis()
- ax.set_format()
- plt.dateformat()
- ax.xaxis.set_major_formatter(...)
Answer: ax.xaxis.set_major_formatter(...). ax.xaxis.set_major_formatter(mdates.DateFormatter(...)) applies the format.
What does the format code %b produce?
- The short month name (e.g. Jan)
- The full year
- The day number
- The weekday
Answer: The short month name (e.g. Jan). %b is the abbreviated month name, the same strftime code Python uses.
What does %Y produce in a DateFormatter string?
- The two-digit year
- The four-digit year
- The month
- The hour
Answer: The four-digit year. %Y is the four-digit year, e.g. 2024.
Which call rotates crowded date labels so they don't overlap?
- ax.rotate()
- plt.tilt()
- fig.autofmt_xdate()
- ax.spread_labels()
Answer: fig.autofmt_xdate(). fig.autofmt_xdate() rotates and right-aligns the date labels.
Why might dates show as plain numbers instead of dates?
- The figure is too small
- autofmt was called
- viridis was used
- You passed date strings instead of date objects
Answer: You passed date strings instead of date objects. Build real date objects with date(2024, 1, 1), not strings.
Which import gives you the date type?
- from datetime import date
- import dates
- from time import date
- import calendar
Answer: from datetime import date. from datetime import date provides the date class.
What does the format string '%b %Y' render for January 2024?
- 2024-01
- Jan 2024
- 01/2024
- January
Answer: Jan 2024. %b %Y produces the short month and four-digit year, e.g. 'Jan 2024'.
Continue this course
- Previous: Annotations & Text
- Next: Twin Axes & Secondary Y — Plot two different scales on one chart with twinx
- Quick reference: Matplotlib cheat sheet
Frequently asked questions
Can Matplotlib plot dates directly?
Yes. If you pass a list of Python datetime or date objects as the x values, Matplotlib recognizes them as dates and spaces them correctly along a time axis automatically.
What is matplotlib.dates for?
The matplotlib.dates module (imported as mdates) gives you tools to control date tick locations and formatting — for example mdates.DateFormatter('%b %Y') to show ticks like 'Jan 2024'.
Why are my date labels overlapping?
Long date labels crowd together. Call fig.autofmt_xdate() and Matplotlib will rotate and right-align them so they stay readable.
How do I control the date label format?
Use ax.xaxis.set_major_formatter(mdates.DateFormatter('%b %Y')). The format codes are the same strftime codes Python uses — %b is the short month, %Y the four-digit year.