Annotations & Text
Reviewed & published by Brayan K
Matplotlib is a Python library for creating charts and visualizations — and annotations let you write labels directly on a chart and draw arrows pointing at the exact data points that matter.
Part of the free Matplotlib course at LearnCodingFast — hands-on lessons with worked examples and the output they print, plus practice exercises and a quick quiz.
In this lesson you'll add free-floating text with plt.text(), point arrows at a peak with ax.annotate(), and wrap labels in a styled box.
What You'll Learn in This Lesson
- Placing plain text with plt.text()
- Pointing arrows with ax.annotate()
- What xy and xytext control
- Building an arrow with arrowprops
- Highlighting a maximum point
- Wrapping a label in a styled bbox
1 Adding Plain Text with plt.text()
The simplest way to write on a chart is plt.text(x, y, "label"). The first two arguments are data coordinates — where on the chart the text begins — and the third is the string to show.
import matplotlib.pyplot as plt

x = [0, 1, 2, 3, 4, 5]
y = [0, 1, 4, 9, 16, 25]

plt.plot(x, y, marker='o')

# Place a label at the data point (3, 9)
plt.text(3, 9, "  x squared", fontsize=11)

plt.title("Labelling a point")
plt.show()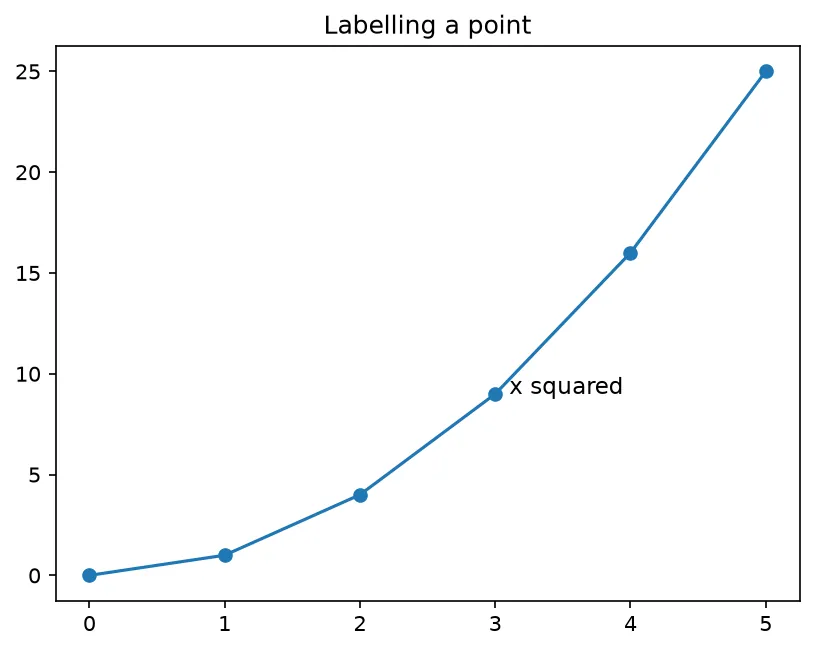
What you'll see: the rising curve with the words "x squared" sitting just beside the point (3, 9). The text floats at that data location with no arrow — that's the difference from annotate().
2 Pointing an Arrow with ax.annotate()
To draw an arrow from a label to a target point, use ax.annotate(). The xy argument is the point the arrow points to; xytext is where the label sits; and arrowprops describes the arrow itself.
import matplotlib.pyplot as plt

x = [1, 2, 3, 4, 5]
y = [10, 25, 15, 30, 20]

fig, ax = plt.subplots()
ax.plot(x, y, marker='o')

# Arrow points TO (4, 30); text sits at (2.5, 32)
ax.annotate(
    "Big jump",
    xy=(4, 30),
    xytext=(2.5, 32),
    arrowprops=dict(arrowstyle="->")
)

ax.set_title("Annotating with an arrow")
plt.show()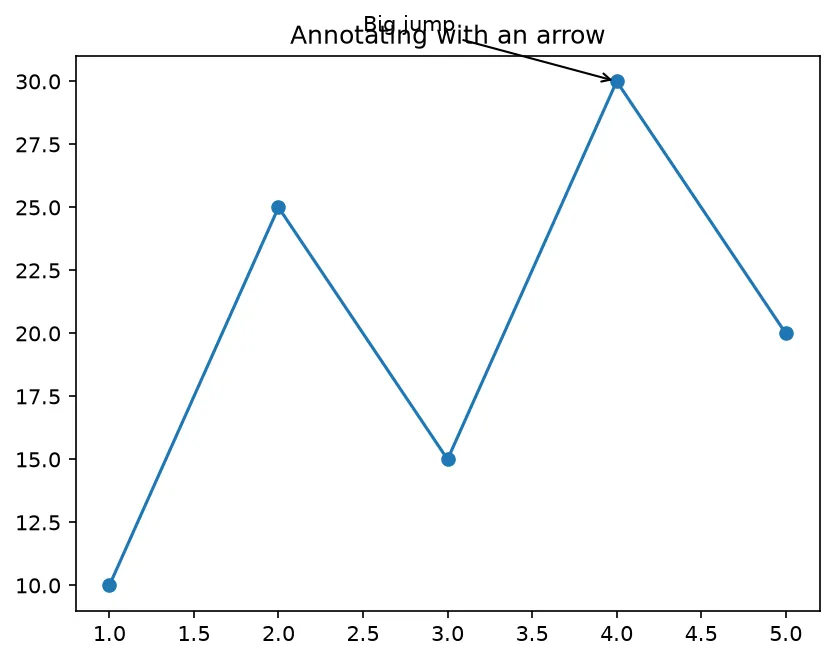
What you'll see: the zig-zag line with the text "Big jump" floating at (2.5, 32) and a thin arrow stretching from those words down to the high point at (4, 30) — drawing the eye straight to it.
A common use is highlighting the maximum. You can find the peak with Python's max() and feed its coordinates into annotate().
import matplotlib.pyplot as plt

x = [1, 2, 3, 4, 5, 6]
y = [3, 8, 5, 12, 9, 6]

fig, ax = plt.subplots()
ax.plot(x, y, marker='o')

# Find the highest point
peak_y = max(y)
peak_x = x[y.index(peak_y)]

ax.annotate(
    f"Max = {peak_y}",
    xy=(peak_x, peak_y),
    xytext=(peak_x - 1.5, peak_y + 1),
    arrowprops=dict(arrowstyle="->", color="red")
)

ax.set_title("Highlighting the maximum")
plt.show()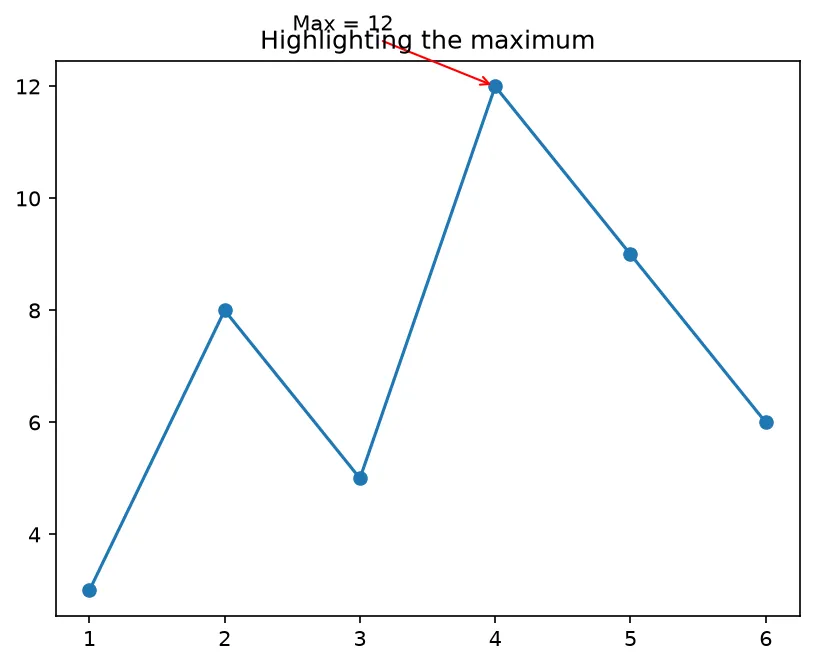
What you'll see: the line chart with a red arrow pointing at the tallest dot (x=4, y=12) and the label "Max = 12" beside it — computed automatically from the data, not hard-coded.
3 Boxing Text with bbox
To make a label stand out, draw a box behind it with the bbox argument. Pass a dictionary that sets the box shape (boxstyle), fill color (facecolor), and transparency (alpha).
import matplotlib.pyplot as plt

x = [0, 1, 2, 3, 4]
y = [1, 3, 2, 5, 4]

plt.plot(x, y, marker='o')

# Text wrapped in a rounded yellow box
plt.text(
    1, 4, "Important!",
    fontsize=12,
    bbox=dict(boxstyle="round", facecolor="yellow", alpha=0.6)
)

plt.title("Text inside a box")
plt.show()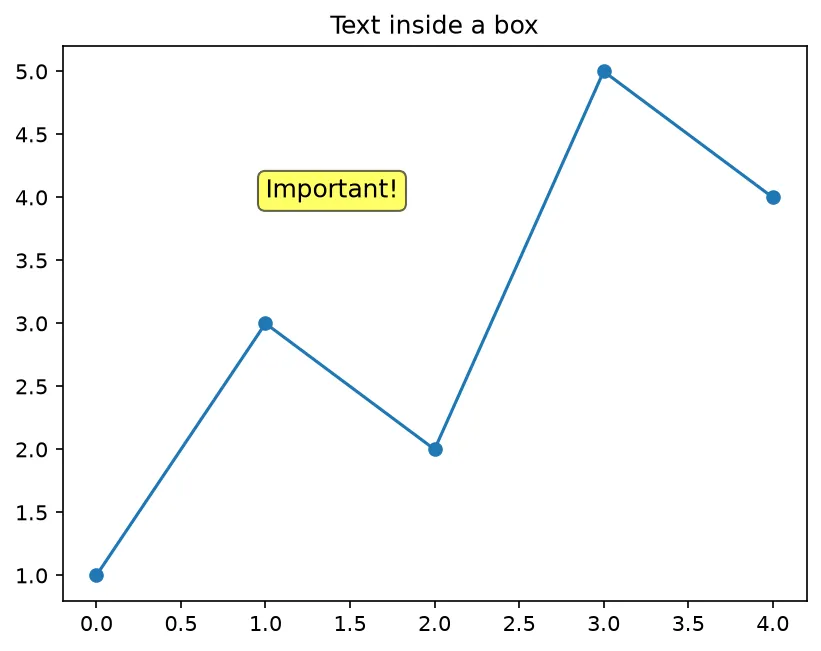
What you'll see: the line chart with the word "Important!" sitting inside a soft, rounded, semi-transparent yellow box near (1, 4) — far more eye-catching than bare text.
🎯 Your Turn: Fill in the Blanks
Replace each ___ to point an arrow at the data point (3, 9).
import matplotlib.pyplot as plt

x = [1, 2, 3, 4]
y = [1, 4, 9, 16]

fig, ax = plt.subplots()
ax.plot(x, y, marker='o')

ax.annotate(
    "Look here",
    ___=(3, 9),          # the point the arrow points to
    xytext=(1.5, 11),    # where the text sits
    arrowprops=dict(arrowstyle="___")   # a simple arrow
)

plt.___()
📋 Common Errors & Quick Reference
❌ My text shows but there's no arrow
You left out arrowprops. Add arrowprops=dict(arrowstyle="->") to draw the arrow.
❌ The label is off the chart
xy and xytext use data coordinates. Pick values inside your axis ranges, not pixels.
| Call | What It Does |
|---|---|
| plt.text(x, y, "s") | Place plain text at a point |
| ax.annotate("s", xy=...) | Text plus optional arrow |
| arrowprops=dict(arrowstyle="->") | Draw the arrow |
| bbox=dict(boxstyle="round", ...) | Box around the text |
🏆 Mini Challenge: Label the Peak
Plot monthly visitors, then point a boxed arrow at the busiest month.
import matplotlib.pyplot as plt

months = ['Jan', 'Feb', 'Mar', 'Apr', 'May']
visitors = [120, 200, 150, 320, 260]

fig, ax = plt.subplots()
ax.plot(months, visitors, marker='o')

# 1. Find the busiest month
peak = max(visitors)
i = visitors.index(peak)

# 2. Annotate it with an arrow and a box
ax.annotate(
    f"Peak: {peak}",
    xy=(i, peak),
    xytext=(i - 1.5, peak + 10),
    arrowprops=dict(arrowstyle="->", color="green"),
    bbox=dict(boxstyle="round", facecolor="lightgreen", alpha=0.6)
)

ax.set_title("Monthly visitors")
plt.show()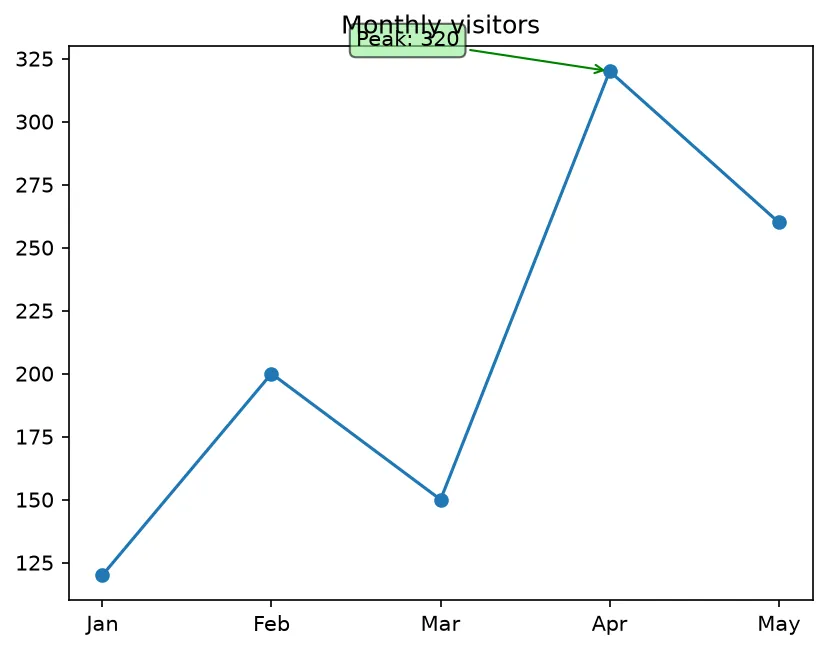
import matplotlib.pyplot as plt

x = [1, 2, 3, 4, 5]
y = [2, 5, 3, 8, 6]

fig, ax = plt.subplots()
ax.plot(x, y, marker="o")

peak = y.index(max(y))
ann = ax.annotate("peak", xy=(x[peak], y[peak]), xytext=(x[peak] - 1.5, y[peak]),
                  arrowprops=dict(arrowstyle="->"))
note = ax.text(1, 7, "hand-placed note")

print("Annotations on the axes:", len(ax.texts))
print("Annotation text:", ann.get_text())
print("Points at:", [int(v) for v in ann.xy])
print("Label sits left of the point:", ann.xyann[0] < ann.xy[0])
print("Plain text:", note.get_text())
print("Peak value:", max(y), "at x =", x[peak])

# ✅ Expected output:
# Annotations on the axes: 2
# Annotation text: peak
# Points at: [4, 8]
# Label sits left of the point: True
# Plain text: hand-placed note
# Peak value: 8 at x = 4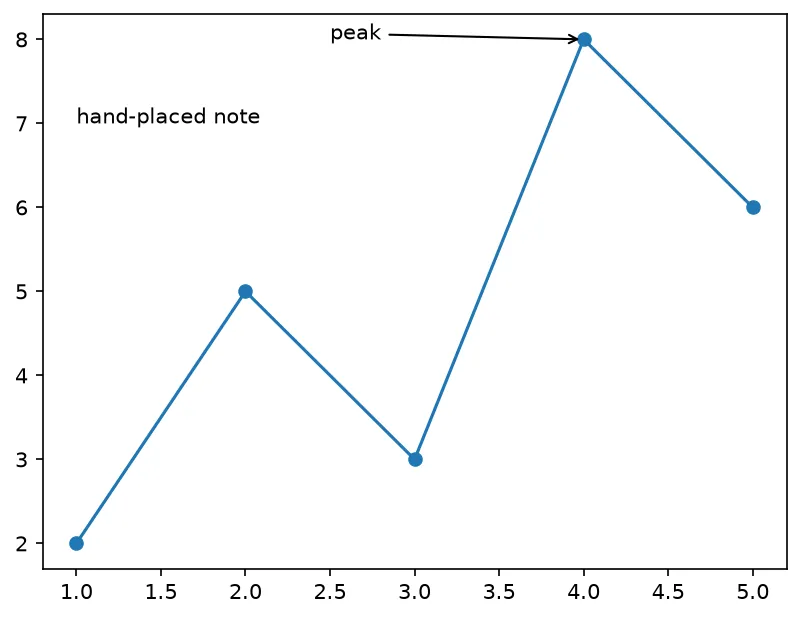
❓ Frequently Asked Questions
Lesson complete — your charts can talk now!
You placed plain text with plt.text(), pointed arrows at a peak with ax.annotate(), and boxed a label with a bbox dictionary.
Practice quiz
What does plt.text(x, y, 'label') do?
- Places plain text at a data coordinate
- Draws an arrow
- Adds a legend
- Sets the axis limits
Answer: Places plain text at a data coordinate. plt.text places a plain string at the given data point with no arrow.
Which function can draw an arrow from a label to a target point?
- plt.text()
- ax.annotate()
- ax.legend()
- plt.grid()
Answer: ax.annotate(). ax.annotate() can draw an arrow using xy, xytext, and arrowprops.
In ax.annotate(), what does the xy argument specify?
- The figure size
- The text color
- The point the arrow points TO
- Where the text sits
Answer: The point the arrow points TO. xy is the data point being highlighted — where the arrow points.
In ax.annotate(), what does xytext specify?
- The arrow style
- The marker shape
- The axis label
- Where the text label sits
Answer: Where the text label sits. xytext is the location of the text label itself.
Which argument actually draws the arrow in annotate()?
- arrowprops
- xytext
- bbox
- fontsize
Answer: arrowprops. Without arrowprops, annotate places text but draws no arrow.
What units do xy and xytext use by default?
- Pixels
- Data coordinates
- Inches
- Points
Answer: Data coordinates. By default xy and xytext are in data coordinates of the axes.
How do you draw a box behind a text label?
- color=
- marker=
- bbox=dict(...)
- alpha=
Answer: bbox=dict(...). The bbox argument takes a dict with boxstyle, facecolor, and alpha.
What does arrowstyle='->' produce in arrowprops?
- A filled rectangle
- A dashed grid
- No arrow
- A simple line arrow with a head
Answer: A simple line arrow with a head. arrowstyle='->' gives a basic line arrow pointing at xy.
If you omit xytext in annotate(), what happens?
- The text is placed at xy with no arrow
- An error is raised
- The arrow doubles in size
- The text disappears
Answer: The text is placed at xy with no arrow. Without xytext the text sits right at xy and no arrow is drawn.
Why might a label land off the chart?
- fontsize is too large
- The arrow is missing
- xy/xytext used values outside the axis ranges
- alpha is set to 1
Answer: xy/xytext used values outside the axis ranges. xy and xytext are data coordinates; values outside the ranges place text off-chart.
Continue this course
- Previous: Styling & Themes
- Next: Plotting with Dates — Plot time series and format date ticks on the x-axis
- Quick reference: Matplotlib cheat sheet › Labels & Legends
Frequently asked questions
What is the difference between plt.text() and ax.annotate()?
plt.text(x, y, 'label') just places text at a point. ax.annotate() does that too, but can also draw an arrow from the text to a target point using the xy and xytext arguments — perfect for pointing at a peak or outlier.
What do xy and xytext mean in annotate()?
xy is the data point the arrow points TO (the thing you're highlighting). xytext is where the text label sits. If you omit xytext, the text is placed right at xy with no arrow.
How do I draw the arrow?
Pass an arrowprops dictionary, for example arrowprops=dict(arrowstyle='->'). Without arrowprops, annotate() places text but draws no arrow at all.
How do I put a box around my text?
Use the bbox argument with a dict, like bbox=dict(boxstyle='round', facecolor='yellow', alpha=0.5). It works with both plt.text() and ax.annotate().