Styling & Themes
Reviewed & published by Brayan K
Matplotlib is a Python library for creating charts and visualizations — and its built-in style sheets let you restyle every chart's colors, fonts, and grids with a single line instead of tweaking each element by hand.
Part of the free Matplotlib course at LearnCodingFast — hands-on lessons with worked examples and the output they print, plus practice exercises and a quick quiz.
In this lesson you'll list the available styles, apply themes like 'ggplot' and 'dark_background' globally, and switch styles temporarily with a context manager.
What You'll Learn in This Lesson
- What a Matplotlib style sheet is
- How to list every available style
- Applying a theme globally with plt.style.use()
- Popular styles: ggplot, bmh, dark_background, seaborn
- Applying a style to just one chart with plt.style.context()
- How styles restyle colors and grids at once
1 Listing the Available Styles
A style is a named bundle of defaults — colors, line widths, fonts, grid lines, and background — that controls how every chart looks. Before applying one, see what's available with plt.style.available.
import matplotlib.pyplot as plt

# Print every style name your installation knows about
print(plt.style.available)

# A few you'll commonly see:
#   'ggplot', 'bmh', 'dark_background',
#   'fivethirtyeight', 'seaborn-v0_8'

# ✅ Expected output:
# ['Solarize_Light2', 'bmh', 'classic', 'dark_background', 'fast', 'fivethirtyeight', 'ggplot', 'grayscale', 'petroff10', 'petroff6', 'petroff8', 'seaborn-v0_8', 'seaborn-v0_8-bright', 'seaborn-v0_8-colorblind', 'seaborn-v0_8-dark', 'seaborn-v0_8-dark-palette', 'seaborn-v0_8-darkgrid', 'seaborn-v0_8-deep', 'seaborn-v0_8-muted', 'seaborn-v0_8-notebook', 'seaborn-v0_8-paper', 'seaborn-v0_8-pastel', 'seaborn-v0_8-poster', 'seaborn-v0_8-talk', 'seaborn-v0_8-ticks', 'seaborn-v0_8-white', 'seaborn-v0_8-whitegrid', 'tableau-colorblind10']
What you'll see: a printed Python list of style names. No chart is drawn here — this just tells you which themes you can pass to plt.style.use() in the next step.
2 Applying a Theme Globally
Call plt.style.use('name') once, near the top of your script, and every chart you draw afterward picks up that theme. The classic 'ggplot' style gives you a gray background with white gridlines, inspired by R's ggplot2.
import matplotlib.pyplot as plt

# Switch the global theme — affects all charts from here on
plt.style.use('ggplot')

months = ['Jan', 'Feb', 'Mar', 'Apr', 'May']
sales = [100, 140, 120, 200, 240]

plt.plot(months, sales, marker='o')
plt.title("Sales with the ggplot theme")
plt.xlabel("Month")
plt.ylabel("Sales")
plt.show()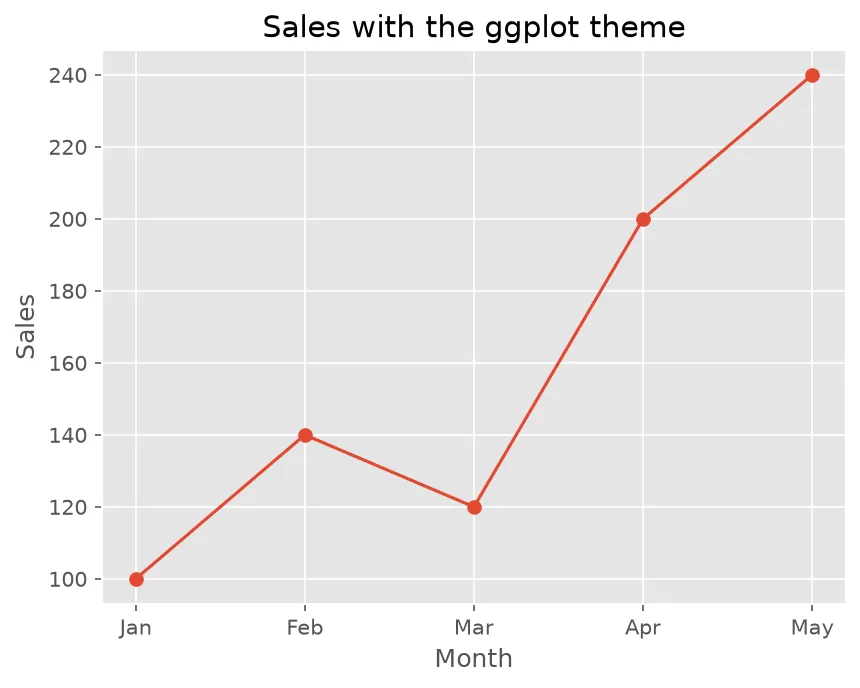
What you'll see: the familiar line plot, but now on a light-gray panel with bold white gridlines and a reddish default line color — the signature ggplot look, applied without styling any element by hand.
Prefer a dark look? Swap in 'dark_background', which inverts everything to light text and lines on a black canvas — great for slideshows.
import matplotlib.pyplot as plt

plt.style.use('dark_background')

x = [0, 1, 2, 3, 4, 5]
y = [0, 1, 4, 9, 16, 25]

plt.plot(x, y, marker='o')
plt.title("Squares on a dark theme")
plt.show()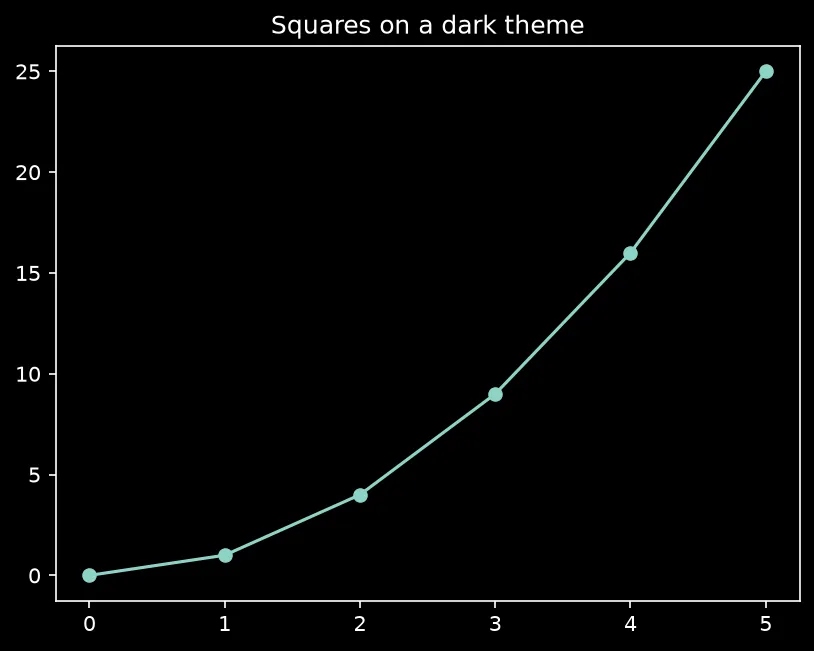
What you'll see: the same rising parabola, but drawn in a bright line on a black background with light-colored axis text and ticks — ideal for dark presentations.
3 Temporary Styles with a Context Manager
Because plt.style.use() is global, it sticks around for the rest of your program. When you want a theme for just one chart, wrap it in with plt.style.context('name'): — the style applies inside the block and is dropped automatically afterward.
import matplotlib.pyplot as plt

data = [5, 9, 7, 12, 10]

# 'bmh' theme applies ONLY inside this block
with plt.style.context('bmh'):
    plt.plot(data, marker='o')
    plt.title("Temporary bmh styling")
    plt.show()

# Out here, the default style is back in effect
plt.plot(data)
plt.title("Back to the default style")
plt.show()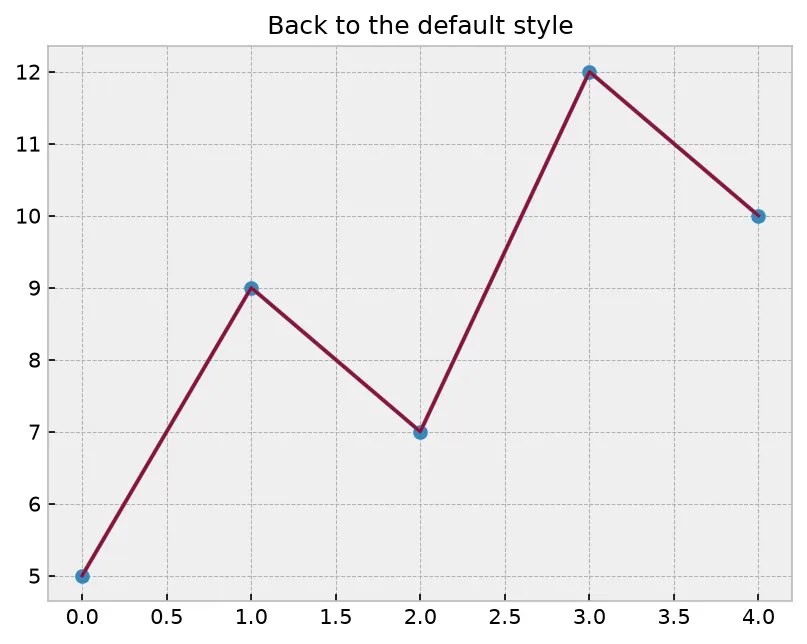
What you'll see: two windows. The first uses the soft, colorful bmh theme; the second reverts to Matplotlib's plain default — proof the context manager only styled the chart inside its block.
🎯 Your Turn: Fill in the Blanks
Replace each ___ to apply the 'fivethirtyeight' theme and plot some data.
import matplotlib.pyplot as plt

# Apply the theme globally
plt.style.___('fivethirtyeight')

years = [2019, 2020, 2021, 2022]
users = [50, 120, 300, 540]

plt.___(years, users, marker='o')
plt.title("Users over time")

# Show the chart
plt.___()
📋 Common Errors & Quick Reference
❌ OSError: 'seaborn' is not a valid package style
The plain seaborn names were renamed. Use 'seaborn-v0_8' (or check plt.style.available).
❌ My theme leaked into later charts
plt.style.use() is global. For a one-off, use with plt.style.context('name'): instead.
| Call | What It Does |
|---|---|
| plt.style.available | List all style names |
| plt.style.use('ggplot') | Apply a theme globally |
| plt.style.use(['a', 'b']) | Combine styles (later wins) |
| with plt.style.context('bmh'): | Apply a theme temporarily |
🏆 Mini Challenge: Compare Two Themes
Draw the same data once with 'ggplot' globally, then once temporarily with 'dark_background'.
import matplotlib.pyplot as plt

x = [1, 2, 3, 4, 5]
y = [2, 5, 4, 8, 7]

# 1. Apply ggplot globally and plot
plt.style.use('ggplot')
plt.plot(x, y, marker='o')
plt.title("ggplot theme")
plt.show()

# 2. Use dark_background just for this chart
with plt.style.context('dark_background'):
    plt.plot(x, y, marker='o')
    plt.title("dark_background theme")
    plt.show()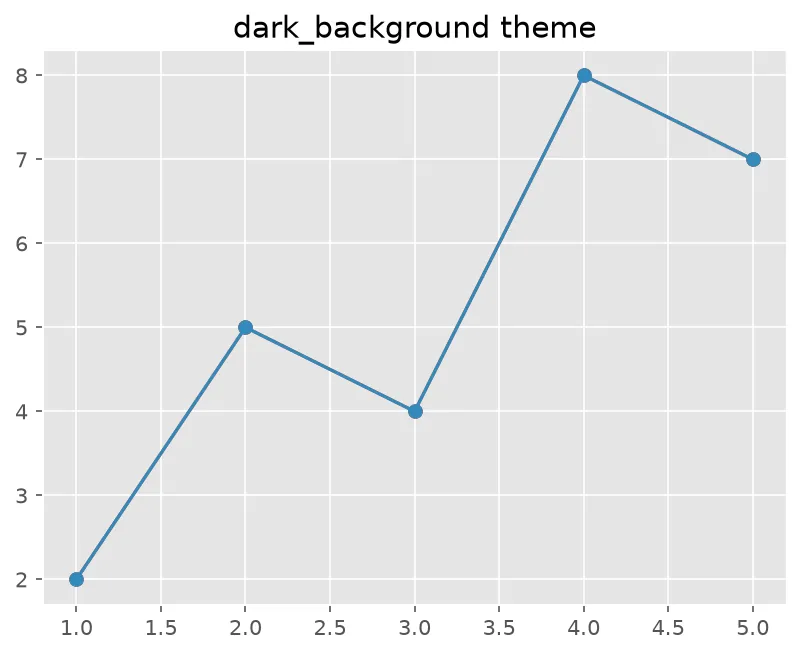
❓ Frequently Asked Questions
Lesson complete — your charts now have style!
You listed the available themes, applied ggplot and dark_background globally, and scoped a style to a single chart with a context manager.
Practice quiz
What does a Matplotlib style sheet bundle together?
- Default colors, fonts, grids, and background for every chart
- Only the figure size
- The data passed to plot()
- A list of saved image files
Answer: Default colors, fonts, grids, and background for every chart. A style is a named bundle of defaults that controls how every chart looks.
Which call lists every available built-in style name?
- plt.style.list()
- plt.style.available
- plt.show_styles()
- plt.styles()
Answer: plt.style.available. plt.style.available returns the list of style names your installation knows about.
How do you apply a theme globally for the rest of the program?
- plt.theme('ggplot')
- plt.set_style('ggplot')
- plt.style.use('ggplot')
- plt.apply('ggplot')
Answer: plt.style.use('ggplot'). plt.style.use('name') sets that style globally for every chart drawn afterward.
Which theme gives light text and lines on a black canvas?
- 'ggplot'
- 'bmh'
- 'fivethirtyeight'
- 'dark_background'
Answer: 'dark_background'. 'dark_background' inverts everything to light elements on black, great for slideshows.
How do you apply a style to just one chart and drop it afterward?
- with plt.style.context('bmh'):
- plt.style.once('bmh')
- plt.style.temp('bmh')
- plt.style.use('bmh', temp=True)
Answer: with plt.style.context('bmh'):. The context manager applies the style inside its block and reverts automatically.
What happens to charts after plt.style.use('ggplot')?
- Only the next chart uses ggplot
- Every chart from then on uses ggplot until changed
- Nothing changes until you call show()
- Only bar charts are affected
Answer: Every chart from then on uses ggplot until changed. plt.style.use() is global and sticks around for the rest of the program.
Why were the plain 'seaborn' style names renamed?
- They were deleted entirely
- Seaborn became a paid library
- Modern Matplotlib uses names like 'seaborn-v0_8' instead
- They only work in Jupyter
Answer: Modern Matplotlib uses names like 'seaborn-v0_8' instead. Use 'seaborn-v0_8' (or check plt.style.available); plain 'seaborn' is no longer valid.
What does plt.style.use(['seaborn-v0_8', 'dark_background']) do?
- Raises an error — only one style is allowed
- Picks one style at random
- Ignores the list entirely
- Applies styles left to right, later ones override earlier
Answer: Applies styles left to right, later ones override earlier. A list of styles is applied in order, so later styles win where they overlap.
Which classic theme is inspired by R's ggplot2?
- 'ggplot'
- 'classic'
- 'grayscale'
- 'tableau'
Answer: 'ggplot'. 'ggplot' gives a gray background with white gridlines, inspired by ggplot2.
What error appears if you pass an outdated 'seaborn' style?
- SyntaxError
- OSError: 'seaborn' is not a valid package style
- ValueError: bad color
- ImportError: no seaborn module
Answer: OSError: 'seaborn' is not a valid package style. The plain seaborn names were renamed; use 'seaborn-v0_8' or check plt.style.available.
Continue this course
- Previous: Subplots & Layouts
- Next: Annotations & Text — Highlight key points with text, arrows, and annotate
- Quick reference: Matplotlib cheat sheet › Styling
Frequently asked questions
What is a Matplotlib style?
A style is a named bundle of default settings — colors, fonts, grid lines, background — that changes how every chart looks at once. You apply one with plt.style.use('name') instead of styling each element by hand.
How do I see which styles are available?
Run print(plt.style.available). It returns a list of every built-in style name your installation knows about, such as 'ggplot', 'bmh', 'dark_background', and the 'seaborn-v0_8' family.
Does plt.style.use() change every chart?
Yes. Calling plt.style.use('ggplot') sets that style globally for the rest of your program. To apply a style to just one chart, use the temporary 'with plt.style.context(...)' block instead.
Can I combine styles?
Yes. plt.style.use() accepts a list, like plt.style.use(['seaborn-v0_8', 'dark_background']). Styles are applied left to right, so later ones override earlier ones where they overlap.