Subplots & Layouts
Reviewed & published by Brayan K
Matplotlib is a Python library for creating charts and visualizations — and subplots let you arrange several charts in a grid inside one figure so they can be compared at a glance.
Part of the free Matplotlib course at LearnCodingFast — hands-on lessons with worked examples and the output they print, plus practice exercises and a quick quiz.
In this lesson you'll create a grid with plt.subplots(), draw on each cell, share axes, and tidy the spacing with tight_layout.
What You'll Learn in This Lesson
- Creating a grid with plt.subplots()
- Indexing axes with axs[row, col]
- Setting figure size with figsize
- Sharing scales with sharex and sharey
- Adding a figure title with fig.suptitle()
- Fixing spacing with plt.tight_layout()
1 Creating a Grid of Plots
plt.subplots(rows, cols) builds a grid in one call and returns the figure and an array of axes. You then draw on each cell with axs[row, col] — a more explicit, object-oriented style than the plain plt. calls.
import matplotlib.pyplot as plt
import numpy as np

x = np.linspace(0, 10, 100)

# A 2-by-2 grid of plots, 10x8 inches
fig, axs = plt.subplots(2, 2, figsize=(10, 8))

axs[0, 0].plot(x, np.sin(x))
axs[0, 0].set_title("Sine")

axs[0, 1].plot(x, np.cos(x))
axs[0, 1].set_title("Cosine")

axs[1, 0].plot(x, x)
axs[1, 0].set_title("Linear")

axs[1, 1].plot(x, np.sqrt(x))
axs[1, 1].set_title("Square Root")

plt.tight_layout()
plt.show()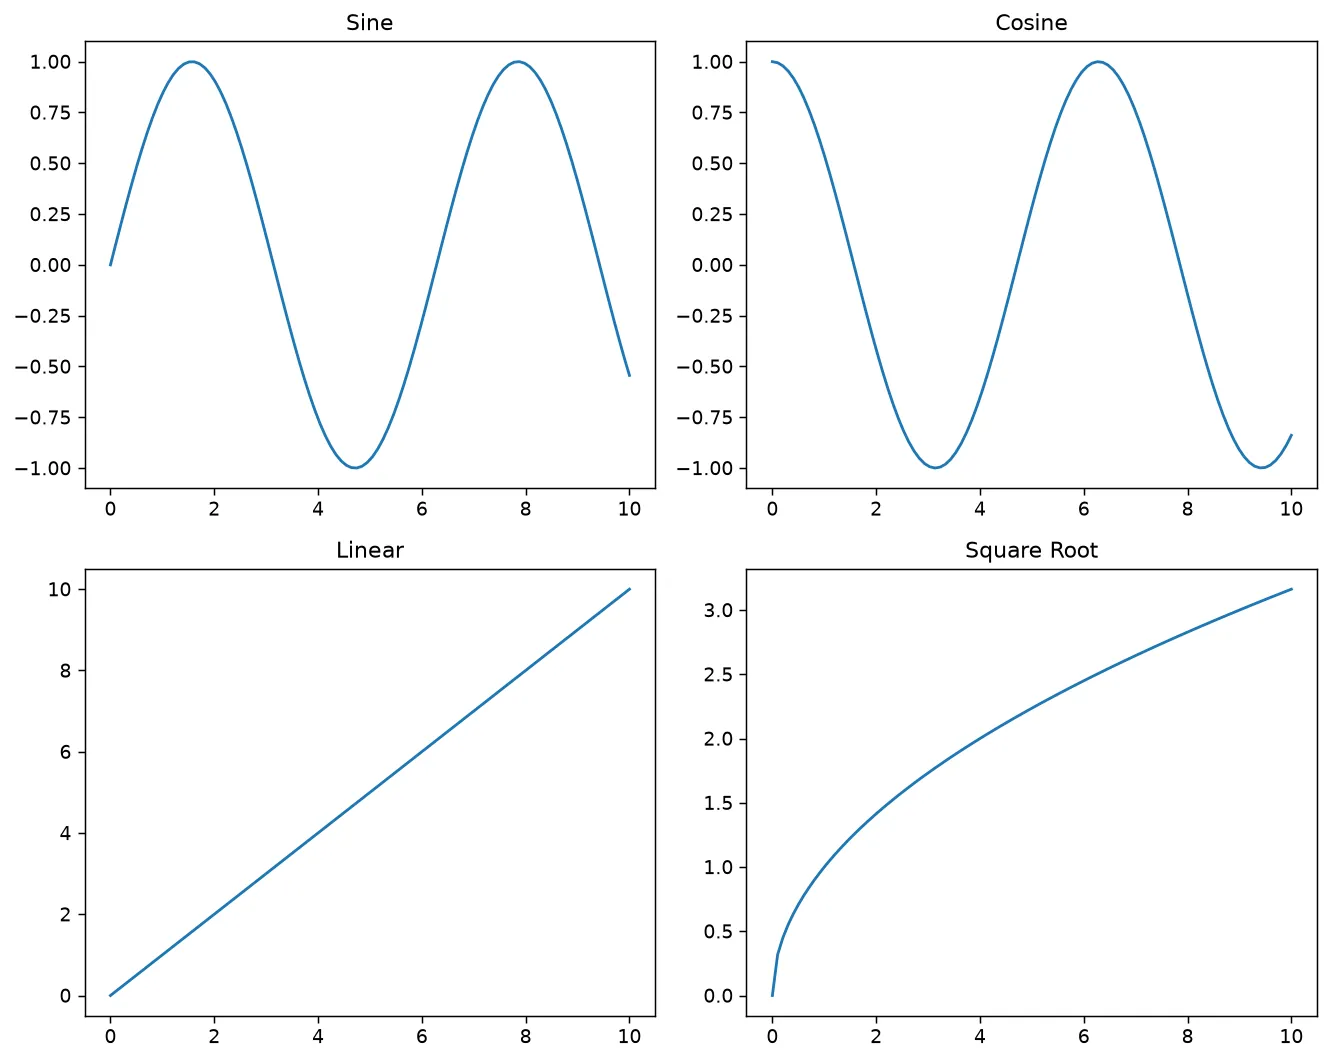
What you'll see: one figure split into four panels. The top row shows a sine and cosine wave, the bottom row a straight line and a square-root curve, each with its own title, and tight_layout keeps them neatly spaced.
2 Sharing Axes & a Figure Title
When plots share a scale, pass sharex=True or sharey=True so their axes line up and duplicate tick labels disappear. Add one overarching title with fig.suptitle().
import matplotlib.pyplot as plt
import numpy as np

x = np.linspace(0, 5, 50)

# Two stacked plots sharing the same x-axis
fig, axs = plt.subplots(2, 1, figsize=(8, 6), sharex=True)

axs[0].plot(x, np.exp(x), color="crimson")
axs[0].set_ylabel("exp(x)")

axs[1].plot(x, np.log(x + 1), color="navy")
axs[1].set_ylabel("log(x+1)")
axs[1].set_xlabel("x")

fig.suptitle("Growth vs Diminishing Returns")
plt.tight_layout()
plt.show()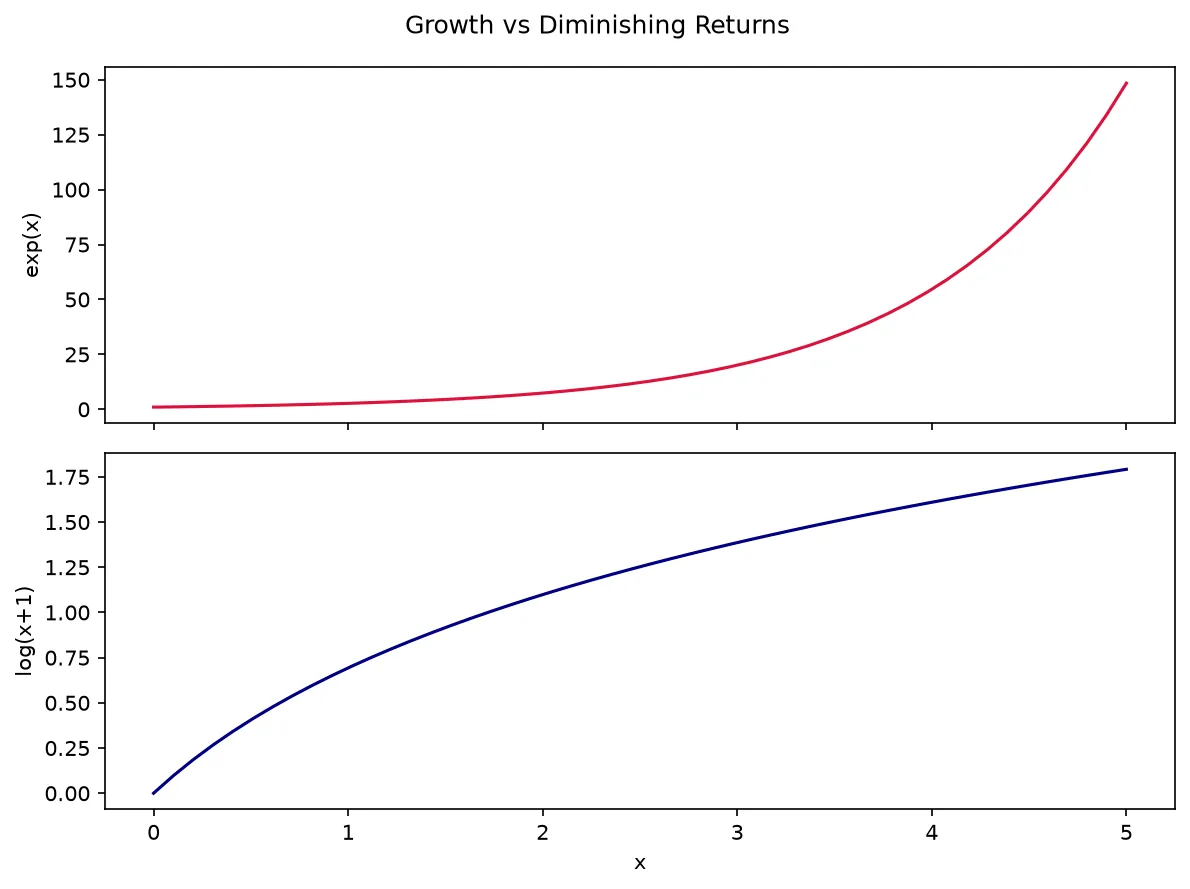
What you'll see: two charts stacked vertically. The top one rises steeply (an exponential) while the bottom one flattens out (a logarithm). They share one x-axis at the bottom, and a single bold title sits above the whole figure.
3 Mixing Chart Types in One Figure
Each axes is independent, so a single figure can mix a line plot, a bar chart, and a scatter plot. A 1×3 row is perfect for a quick dashboard.
import matplotlib.pyplot as plt
import numpy as np

fig, axs = plt.subplots(1, 3, figsize=(12, 4))

# Line plot
axs[0].plot([1, 2, 3, 4], [10, 20, 15, 25])
axs[0].set_title("Line")

# Bar chart
axs[1].bar(["A", "B", "C"], [5, 9, 3], color="orange")
axs[1].set_title("Bar")

# Scatter plot
np.random.seed(0)
axs[2].scatter(np.random.rand(40), np.random.rand(40), color="green")
axs[2].set_title("Scatter")

fig.suptitle("Mini Dashboard")
plt.tight_layout()
plt.show()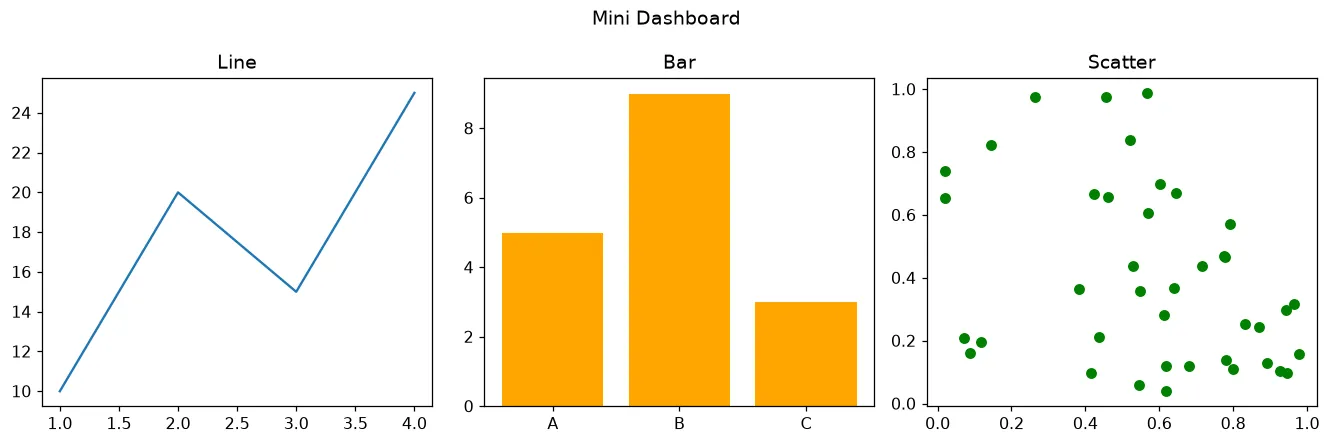
What you'll see: three panels side by side in a single wide figure — a line on the left, an orange bar chart in the middle, and a green scatter cloud on the right — all under one shared "Mini Dashboard" title.
🎯 Your Turn: Fill in the Blanks
Replace each ___ to build a 1×2 grid and tidy the spacing.
import matplotlib.pyplot as plt

# Create a figure with 1 row and 2 columns
fig, axs = plt.___(1, 2, figsize=(10, 4))

# Draw on the first cell
axs[0].plot([1, 2, 3], [1, 4, 9])
axs[0].set_title("Squares")

# Draw on the second cell
axs[1].bar(["X", "Y"], [3, 7])
axs[1].set_title("Bars")

# Fix the spacing
plt.___()

# Display the figure
plt.___()
📋 Common Errors & Quick Reference
❌ TypeError: 'AxesSubplot' object is not subscriptable
With a single row or column, axs is 1D — use axs[0], not axs[0, 0].
❌ Titles overlap the plots below
Call plt.tight_layout() after drawing everything to space the panels out.
| Call | What It Does |
|---|---|
| plt.subplots(2, 2) | Make a 2×2 grid |
| axs[0, 1].plot(...) | Draw on one cell |
| fig.suptitle("...") | Title for the whole figure |
| plt.tight_layout() | Auto-space the panels |
🏆 Mini Challenge: Two-Panel Report
Build a side-by-side figure with a line plot and a bar chart, each titled, under one super-title.
import matplotlib.pyplot as plt

fig, axs = plt.subplots(1, 2, figsize=(10, 4))

# Left: monthly trend
months = [1, 2, 3, 4, 5]
sales = [100, 130, 120, 160, 180]
axs[0].plot(months, sales, marker="o")
axs[0].set_title("Sales Trend")

# Right: category totals
axs[1].bar(["North", "South", "East"], [50, 70, 40], color="steelblue")
axs[1].set_title("Region Totals")

fig.suptitle("Quarterly Report")
plt.tight_layout()
plt.show()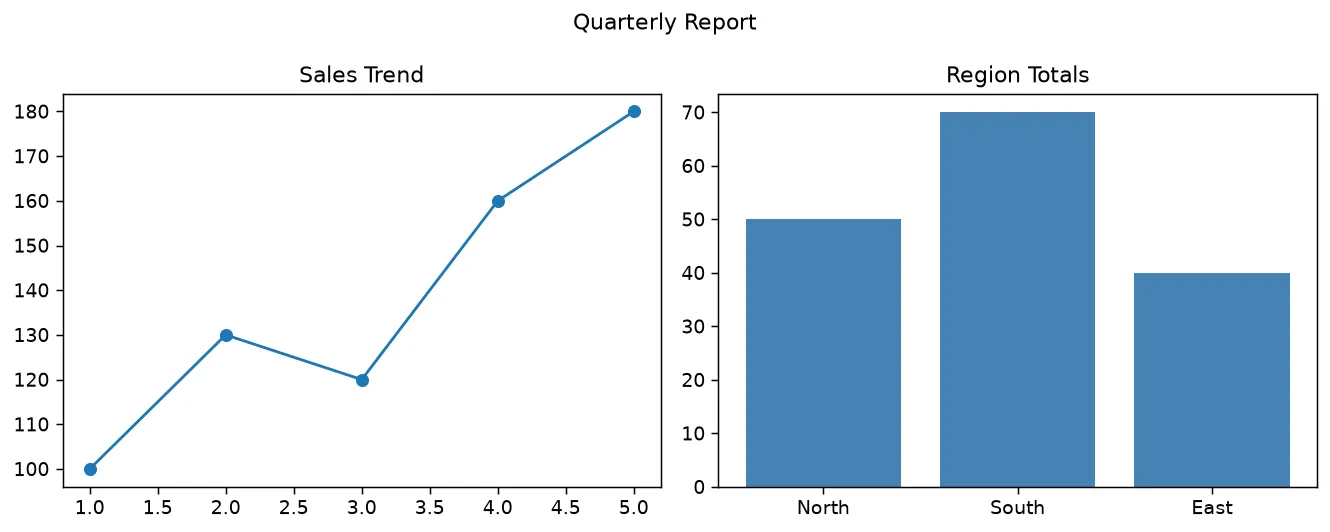
import matplotlib.pyplot as plt

fig, (top, bottom) = plt.subplots(2, 1, sharex=True, figsize=(6, 5))

top.plot([1, 2, 3, 4], [10, 12, 9, 15])
top.set_ylabel("visits")

bottom.bar([1, 2, 3, 4], [3, 1, 4, 2])
bottom.set_ylabel("sales")
bottom.set_xlabel("week")

fig.tight_layout()

print("Axes created:", len(fig.axes))
print("They share the x axis:", top.get_shared_x_axes().joined(top, bottom))
print("Top y label:", top.get_ylabel())
print("Bottom y label:", bottom.get_ylabel())
print("Only the bottom has an x label:", top.get_xlabel() == "" and bottom.get_xlabel() == "week")
print("Same x range:", top.get_xlim() == bottom.get_xlim())

# ✅ Expected output:
# Axes created: 2
# They share the x axis: True
# Top y label: visits
# Bottom y label: sales
# Only the bottom has an x label: True
# Same x range: True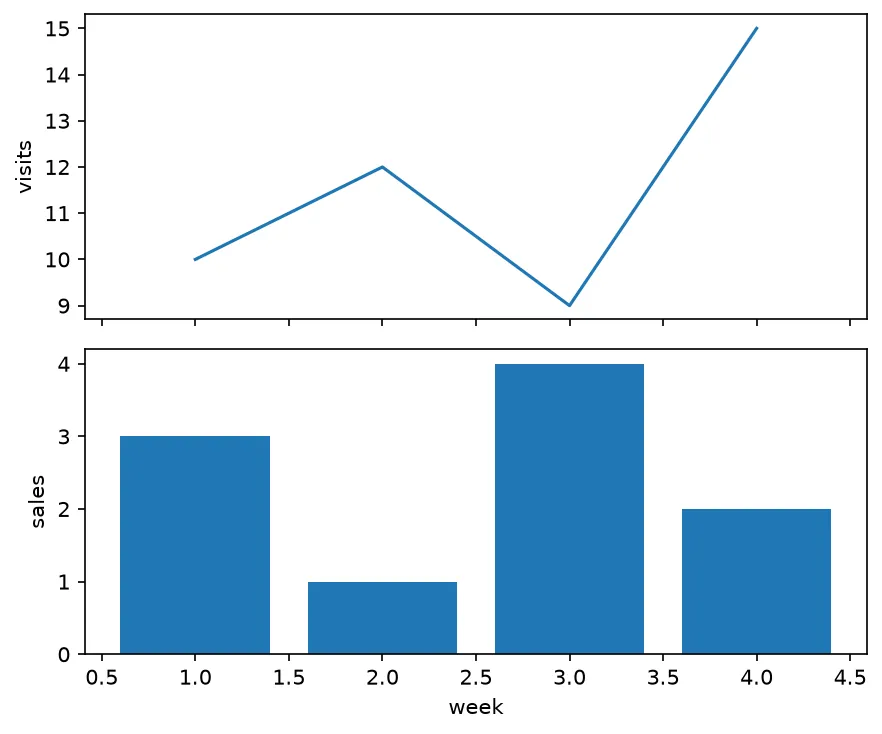
❓ Frequently Asked Questions
Lesson complete — you can build multi-panel figures!
You created grids with plt.subplots(), drew on each cell, shared axes, added a figure title, and used tight_layout to keep everything spaced cleanly.
Practice quiz
What does plt.subplots(2, 2) return?
- The figure and an array of axes
- Only a single axes
- A list of figures
- The pixel dimensions of the grid
Answer: The figure and an array of axes. plt.subplots(rows, cols) returns the figure and an array of axes.
How do you draw on the top-right cell of a 2x2 grid?
- axs.plot(0, 1)
- axs[0, 1].plot(...)
- axs(0)(1).plot(...)
- plt.cell(0, 1).plot(...)
Answer: axs[0, 1].plot(...). For a 2D grid, index the axes array like axs[0, 1] for the top-right cell.
Which argument makes subplots share the same x-axis scale?
- linkx=True
- samex=True
- sharex=True
- joinx=True
Answer: sharex=True. Passing sharex=True aligns the x-axes and removes duplicate inner tick labels.
How do you add one title above all the subplots?
- ax.set_title('...')
- plt.title('...')
- axs.title('...')
- fig.suptitle('...')
Answer: fig.suptitle('...'). fig.suptitle() places a single super-title at the top of the whole figure.
What sets the overall figure dimensions in plt.subplots()?
- size=(10, 8)
- figsize=(10, 8)
- dimensions=(10, 8)
- shape=(10, 8)
Answer: figsize=(10, 8). figsize=(width, height) sets the figure size in inches.
Which call auto-spaces panels so titles stop overlapping?
- plt.fix()
- plt.spacing()
- plt.tight_layout()
- plt.adjust()
Answer: plt.tight_layout(). plt.tight_layout() adjusts spacing after you've drawn everything.
For plt.subplots(1, 3), how is the axes array shaped?
- A scalar axes
- A 2D array indexed by [row, col]
- A dictionary keyed by name
- A 1D array indexed by axs[0], axs[1], axs[2]
Answer: A 1D array indexed by axs[0], axs[1], axs[2]. A single row gives a 1D array, so you index it with axs[0], axs[1], axs[2].
Can a single figure mix a line, a bar, and a scatter plot?
- Yes — each axes is independent
- No, all subplots must be the same type
- Only with separate figures
- Only if sharex=True
Answer: Yes — each axes is independent. Each axes is independent, so one figure can mix different chart types.
What error does axs[0, 0] raise on a single-row subplot result?
- KeyError: 0
- TypeError: 'AxesSubplot' object is not subscriptable
- ValueError: bad index
- IndexError: out of range
Answer: TypeError: 'AxesSubplot' object is not subscriptable. With one row, axs is 1D — use axs[0], not axs[0, 0].
What does the 'rows' value in plt.subplots(rows, cols) control?
- The figure title
- The colormap
- The number of horizontal rows of plots
- The line color
Answer: The number of horizontal rows of plots. The first argument is the number of rows in the subplot grid.
Continue this course
- Previous: Pie Charts
- Next: Styling & Themes — Apply built-in style sheets to restyle every chart instantly
- Quick reference: Matplotlib cheat sheet › Subplots
Frequently asked questions
What does plt.subplots() return?
It returns two things: the figure object and an array (or single object) of axes. The usual call is fig, axs = plt.subplots(rows, cols), after which you draw on each axes individually with axs[row, col].plot(...).
How do I stop subplots from overlapping?
Call plt.tight_layout() after you have drawn everything. It automatically adjusts the spacing so titles and axis labels no longer collide with neighboring plots.
What do sharex and sharey do?
Passing sharex=True or sharey=True makes the subplots share the same axis scale and tick labels. This keeps plots directly comparable and removes duplicate tick labels from the inner plots.
How do I add one title above all the subplots?
Use fig.suptitle('My Title'). It places a single super-title at the top of the whole figure, separate from each subplot's own title set with ax.set_title().