Pie Charts
Reviewed & published by Brayan K
Matplotlib is a Python library for creating charts and visualizations — and the pie chart is the classic way to show how a single whole splits into proportional slices.
Part of the free Matplotlib course at LearnCodingFast — hands-on lessons with worked examples and the output they print, plus practice exercises and a quick quiz.
In this lesson you'll draw a pie, label each slice with its percentage, explode a slice for emphasis, and keep the circle perfectly round.
What You'll Learn in This Lesson
- Drawing a pie with plt.pie()
- Labeling slices with the labels argument
- Showing percentages with autopct
- Pulling a slice out with explode
- Rotating the start with startangle
- Keeping the pie round with axis('equal')
1 Your First Pie Chart
A pie chart turns a list of values into slices whose angles are proportional to those values. Pass the sizes to plt.pie() with matching labels, and Matplotlib computes the angles for you.
import matplotlib.pyplot as plt

# Share of a monthly budget
labels = ["Rent", "Food", "Transport", "Savings"]
sizes = [40, 25, 15, 20]

plt.pie(sizes, labels=labels)

plt.title("Monthly Budget Breakdown")
plt.axis("equal")   # keep it a perfect circle

plt.show()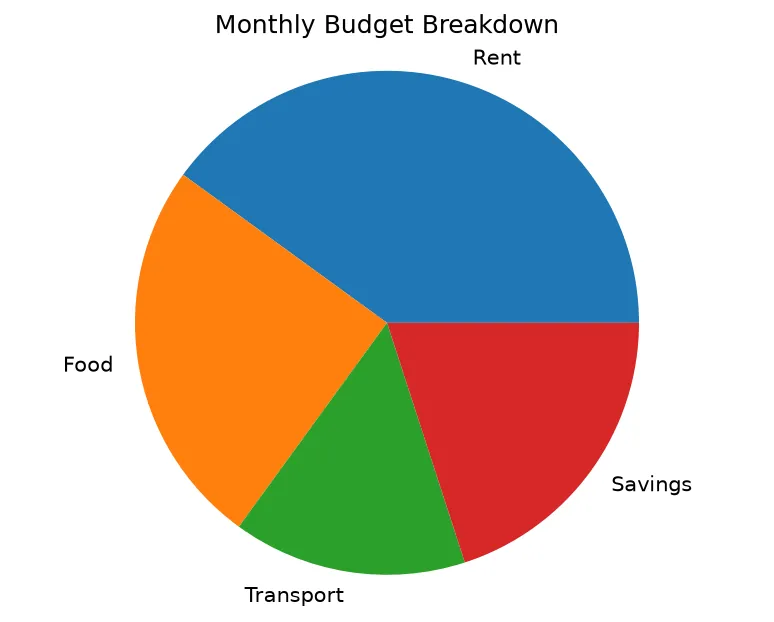
What you'll see: a round pie split into four slices. Rent takes the biggest wedge at 40% of the circle, Transport the smallest, and each slice carries its category name around the edge.
2 Percentages & Start Angle
Add autopct to print each slice's percentage right on the wedge, and use startangle to rotate where the first slice begins. Starting at 90° puts the first slice at the top, which many people find easier to read.
import matplotlib.pyplot as plt

labels = ["Chrome", "Safari", "Edge", "Firefox"]
share = [63, 19, 11, 7]
colors = ["#4285F4", "#34A853", "#0078D7", "#FF7139"]

plt.pie(share, labels=labels, colors=colors,
        autopct="%1.1f%%", startangle=90)

plt.title("Browser Market Share")
plt.axis("equal")

plt.show()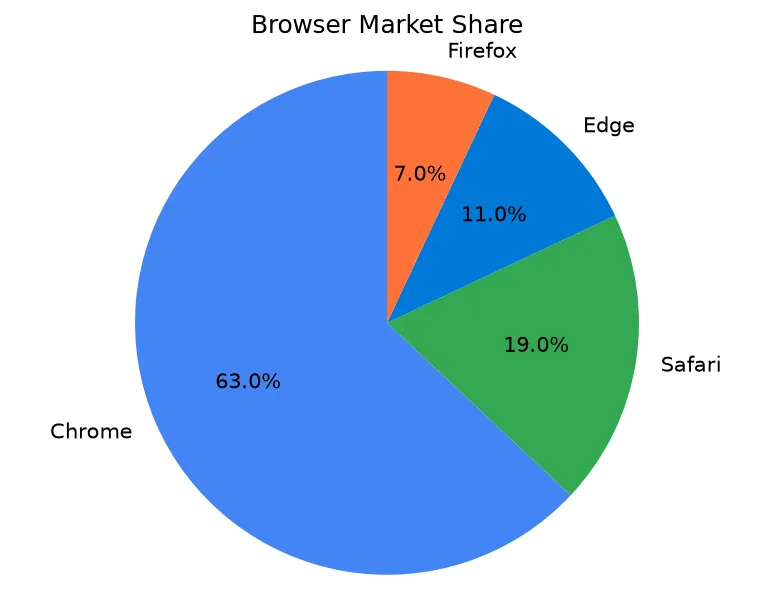
What you'll see: a colored pie where the largest slice (Chrome) starts at the top and the others follow clockwise. Each wedge shows its share as a percentage like 63.0%, so you can read the exact proportions without guessing.
3 Exploding a Slice for Emphasis
To draw attention to one category, explode it outward. Build a list with one number per slice — 0 leaves a slice in place, and a small value like 0.1 pulls it away from the center.
import matplotlib.pyplot as plt

labels = ["Mobile", "Desktop", "Tablet"]
sizes = [58, 34, 8]

# Pull the first slice (Mobile) outward
explode = [0.1, 0, 0]

plt.pie(sizes, labels=labels, explode=explode,
        autopct="%1.1f%%", startangle=140, shadow=True)

plt.title("Traffic by Device")
plt.axis("equal")

plt.show()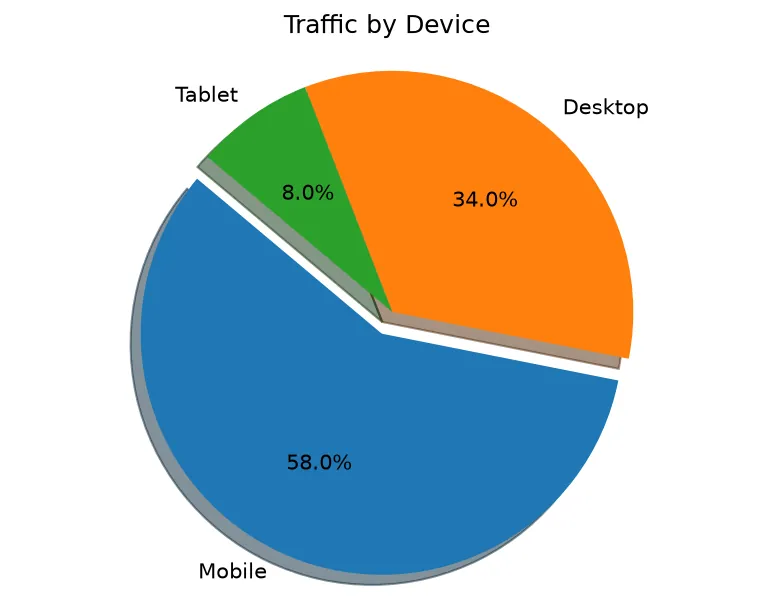
What you'll see: a three-slice pie where the Mobile wedge is nudged away from the center with a subtle drop shadow, making it pop. Every slice still shows its percentage, and the chart stays a clean circle.
🎯 Your Turn: Fill in the Blanks
Replace each ___ to draw a labeled pie with percentage slices.
import matplotlib.pyplot as plt

labels = ["Dogs", "Cats", "Birds"]
sizes = [50, 35, 15]

# Draw the pie with percentage labels
plt.___(sizes, labels=labels, autopct="___")

# Keep the pie a perfect circle
plt.axis("___")

# Display the chart
plt.___()
📋 Common Errors & Quick Reference
❌ Pie looks like an oval
You forgot plt.axis("equal"). Without it the axes stretch and the circle squashes.
❌ ValueError: explode length mismatch
The explode list must have exactly one number per slice — the same length as your sizes list.
| Argument | What It Does |
|---|---|
| labels=[...] | Name each slice |
| autopct="%1.1f%%" | Show percentages |
| explode=[...] | Pull slices outward |
| startangle=90 | Rotate the first slice |
🏆 Mini Challenge: Survey Results
Show favorite seasons as a pie, exploding the most popular slice and showing percentages.
import matplotlib.pyplot as plt

labels = ["Summer", "Winter", "Spring", "Autumn"]
votes = [45, 25, 18, 12]

# Pull out the most popular season (Summer)
explode = [0.1, 0, 0, 0]

plt.pie(votes, labels=labels, explode=explode,
        autopct="%1.1f%%", startangle=90)

plt.title("Favorite Season Survey")
plt.axis("equal")

plt.show()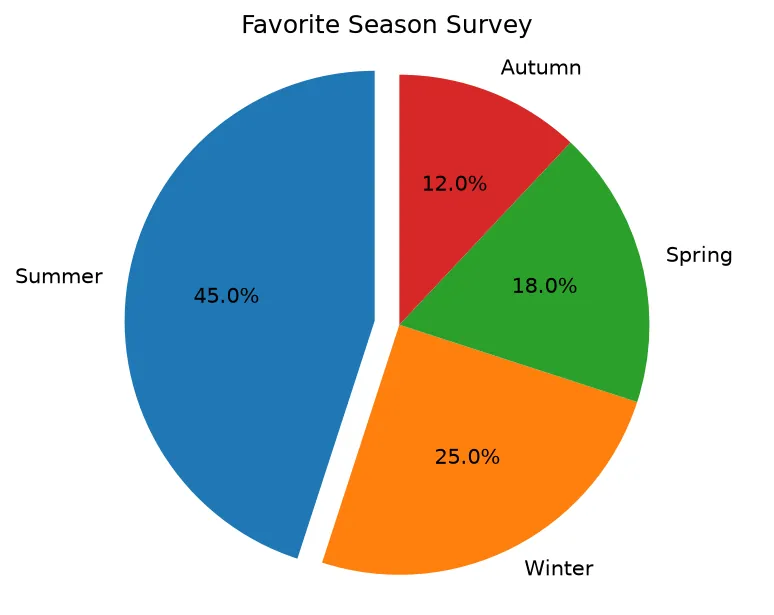
import matplotlib.pyplot as plt

labels = ["Rent", "Food", "Travel", "Other"]
spend = [800, 350, 150, 200]

fig, ax = plt.subplots()
wedges, texts, autotexts = ax.pie(spend, labels=labels, autopct="%1.1f%%", startangle=90)
ax.set_aspect("equal")

print("Wedges:", len(wedges))
print("Labels:", [t.get_text() for t in texts])
print("Percentages:", [t.get_text() for t in autotexts])
print("They add to 100%:", round(sum(spend) / sum(spend) * 100, 1))
print("Biggest slice:", labels[spend.index(max(spend))])
print("Circle, not an oval:", ax.get_aspect() == 1.0)

# ✅ Expected output:
# Wedges: 4
# Labels: ['Rent', 'Food', 'Travel', 'Other']
# Percentages: ['53.3%', '23.3%', '10.0%', '13.3%']
# They add to 100%: 100.0
# Biggest slice: Rent
# Circle, not an oval: True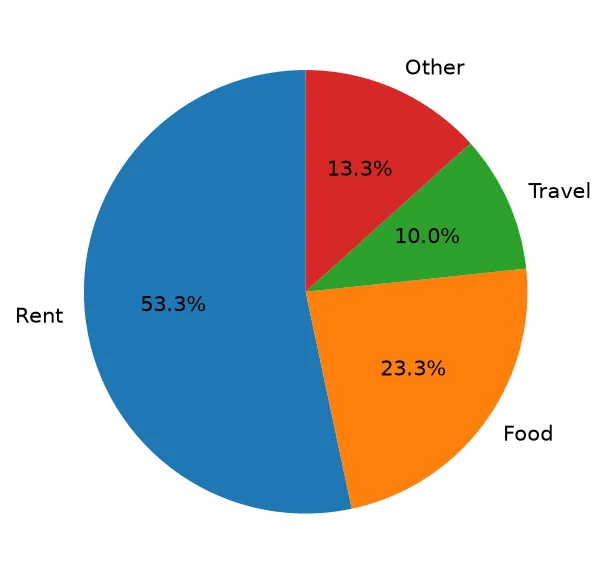
❓ Frequently Asked Questions
Lesson complete — you can show parts of a whole!
You drew pie charts, labeled each slice with its percentage, exploded a slice for emphasis, and kept the circle perfectly round.
Practice quiz
Which call draws a pie chart from a list of values?
- plt.slices()
- plt.circle()
- plt.pie(sizes)
- plt.wedge()
Answer: plt.pie(sizes). plt.pie(sizes) turns the values into proportional slices.
Which argument names each slice?
- labels=[...]
- names=[...]
- tags=[...]
- titles=[...]
Answer: labels=[...]. The labels argument supplies a name for each slice.
What does autopct='%1.1f%%' do?
- Sets slice colors
- Rotates the pie
- Explodes a slice
- Prints each slice's percentage with one decimal
Answer: Prints each slice's percentage with one decimal. autopct formats the percentage label on each wedge, here to one decimal place.
What does the explode list do?
- Hides a slice
- Pulls chosen slices outward from the center
- Colors the slices
- Adds percentages
Answer: Pulls chosen slices outward from the center. explode pushes selected slices away from the center; 0 leaves them in place.
What does startangle=90 do?
- Doubles the pie size
- Hides the labels
- Rotates where the first slice begins
- Adds a shadow
Answer: Rotates where the first slice begins. startangle rotates the starting angle of the first slice, e.g. 90 puts it at the top.
Which call keeps the pie a perfect circle?
- plt.round()
- plt.circle(True)
- plt.aspect('round')
- plt.axis('equal')
Answer: plt.axis('equal'). plt.axis('equal') forces equal x and y scaling so the pie stays round.
Why might a pie render as an oval?
- You forgot plt.axis('equal')
- The values do not sum to 100
- Too few slices
- autopct was missing
Answer: You forgot plt.axis('equal'). Without axis('equal') the axes stretch and the circle squashes into an oval.
What must be true about the explode list length?
- It must be empty
- It must have exactly one number per slice
- It must have two values
- It must sum to 1
Answer: It must have exactly one number per slice. explode needs one entry per slice, matching the sizes list length.
When is a pie chart a poor choice?
- With three categories
- Showing a budget split
- Showing market share
- With many categories that are hard to compare
Answer: With many categories that are hard to compare. Past five or six slices a bar chart usually reads better than a pie.
Do the slice angles in plt.pie reflect the values' proportions?
- No, all slices are equal
- Only if sorted
- Yes, angles are proportional to the values
- Only with autopct set
Answer: Yes, angles are proportional to the values. Matplotlib makes each slice's angle proportional to its value automatically.
Continue this course
- Previous: Scatter Plots
- Next: Subplots & Layouts — Arrange multiple charts in a grid with plt.subplots
- Quick reference: Matplotlib cheat sheet › Plot Types
Frequently asked questions
When should I use a pie chart?
Use a pie chart to show how a single whole divides into a few parts, like market share or budget categories. It works best with a small number of slices; with many categories a bar chart is usually clearer.
What does autopct do in plt.pie()?
autopct formats the percentage label drawn on each slice. Passing autopct='%1.1f%%' shows each share as a number with one decimal place followed by a percent sign, such as 23.4%.
How do I pull a slice out of the pie?
Pass an explode list with one number per slice. A value of 0 keeps the slice in place, while a small value like 0.1 pushes that slice outward to draw attention to it.
Why is my pie chart oval instead of round?
By default the axes can stretch. Call plt.axis('equal') so the x and y scales match, which forces the pie to render as a perfect circle.