Scatter Plots
Reviewed & published by Brayan K
Matplotlib is a Python library for creating charts and visualizations — and the scatter plot is how you reveal the relationship between two numeric variables, one dot per observation.
Part of the free Matplotlib course at LearnCodingFast — hands-on lessons with worked examples and the output they print, plus practice exercises and a quick quiz.
In this lesson you'll plot x against y, resize and recolor points, encode a third variable with color, and add a colorbar legend.
What You'll Learn in This Lesson
- Plotting points with plt.scatter()
- Sizing dots with the s argument
- Coloring dots with a c array and colormap
- Adding a colorbar legend
- Using alpha to reveal dense clusters
- Choosing marker shapes
1 Your First Scatter Plot
A scatter plot places one dot per observation at its (x, y) position. Pass two lists of equal length to plt.scatter() and look for patterns — a rising cloud means the two variables move together.
import matplotlib.pyplot as plt

# Hours studied vs exam score
hours = [1, 2, 3, 4, 5, 6, 7, 8]
scores = [52, 58, 61, 70, 72, 80, 85, 91]

plt.scatter(hours, scores, color="darkorange")

plt.title("Study Time vs Exam Score")
plt.xlabel("Hours Studied")
plt.ylabel("Exam Score")

plt.show()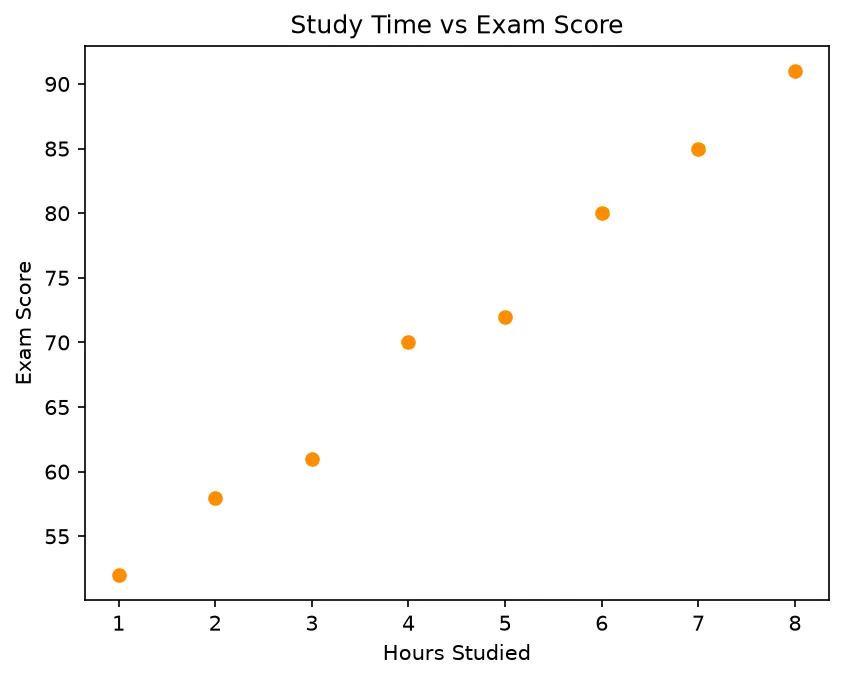
What you'll see: eight orange dots climbing steadily from lower-left to upper-right. The clear upward trend shows that more study hours line up with higher exam scores — a positive correlation.
2 Size, Color & Markers
The s argument controls dot size and marker controls the shape. Lowering alpha makes overlapping points reveal denser regions. Together these turn a plain scatter into a richer picture.
import matplotlib.pyplot as plt
import numpy as np

np.random.seed(3)
x = np.random.rand(200)
y = np.random.rand(200)

# Triangular markers, larger size, semi-transparent
plt.scatter(x, y, s=80, marker="^", alpha=0.5, color="teal")

plt.title("200 Random Points")
plt.xlabel("X")
plt.ylabel("Y")

plt.show()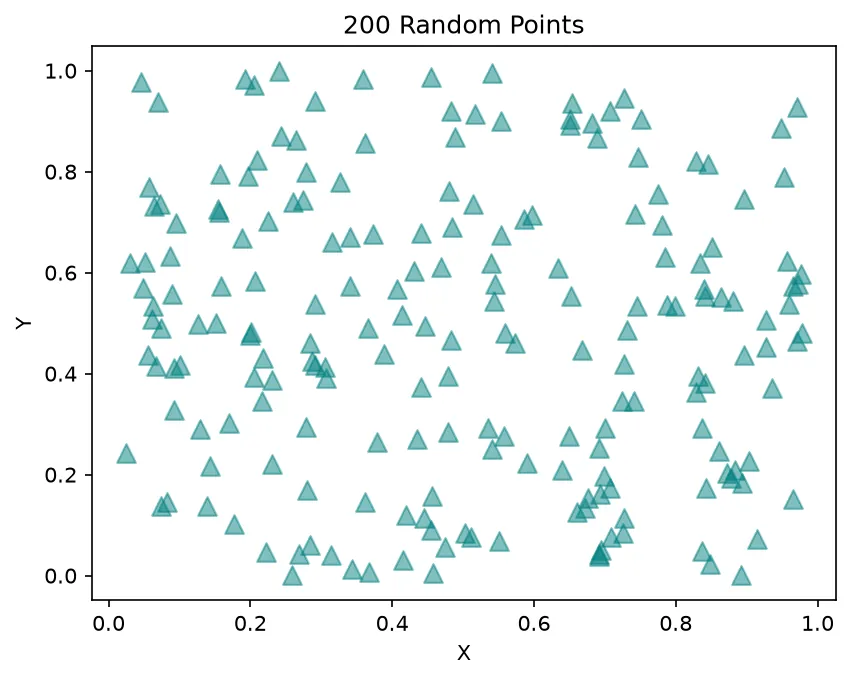
What you'll see: 200 teal triangles scattered randomly across a unit square. Because alpha is 0.5, spots where triangles overlap look darker, hinting at where points cluster.
3 Encoding a Third Variable With Color
A scatter plot can show a third dimension: pass an array to c and a colormap with cmap, then call plt.colorbar() to add a legend mapping colors back to values.
import matplotlib.pyplot as plt
import numpy as np

np.random.seed(4)
x = np.random.rand(150)
y = np.random.rand(150)
temps = np.random.rand(150) * 100   # the third variable

# Color each point by its temperature value
plt.scatter(x, y, c=temps, cmap="viridis", s=60)

# Add a legend bar for the color scale
plt.colorbar(label="Temperature")

plt.title("Points Colored by Temperature")
plt.xlabel("X")
plt.ylabel("Y")

plt.show()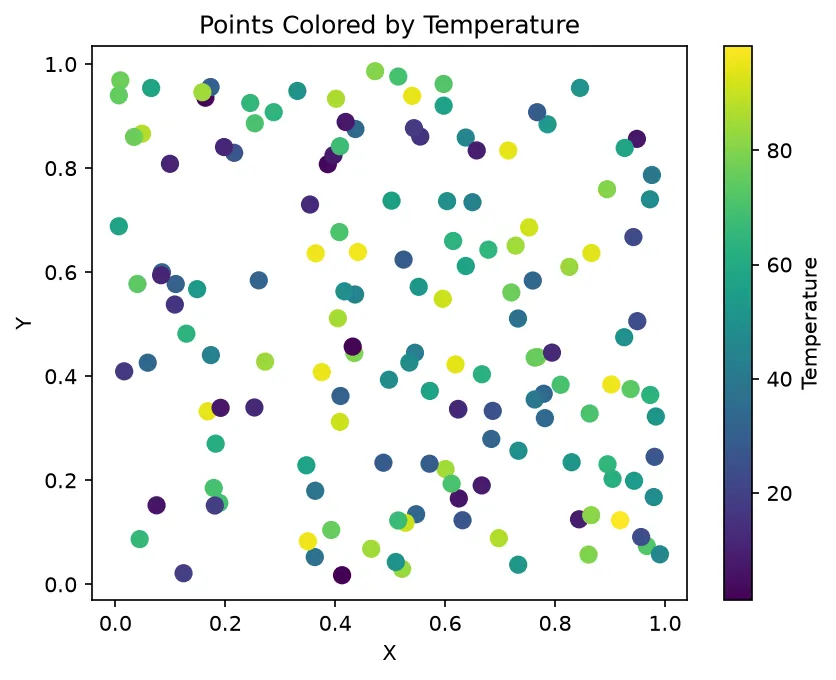
What you'll see: 150 dots scattered across the square, each shaded from dark purple (low) through green to bright yellow (high) according to its temperature. A vertical colorbar on the right labels exactly which color maps to which value.
🎯 Your Turn: Fill in the Blanks
Replace each ___ to plot points and label both axes.
import matplotlib.pyplot as plt

weight = [55, 62, 70, 78, 85]
height = [160, 168, 175, 180, 188]

# Draw a scatter plot of weight vs height
plt.___(weight, height, color="purple")

# Label the x-axis
plt.___("Weight (kg)")

# Display the chart
plt.___()
📋 Common Errors & Quick Reference
❌ ValueError: x and y must be the same size
Your x and y lists have different lengths. Every point needs both an x and a y value.
❌ Colorbar shows nothing useful
You called plt.colorbar() without a c array. The colorbar maps the values you pass to c.
| Argument | What It Does |
|---|---|
| s=80 | Dot size |
| c=values | Color each dot by a value |
| cmap="viridis" | Colormap to use |
| marker="^" | Marker shape (triangle) |
🏆 Mini Challenge: Bubble Chart
Build a bubble chart where dot size encodes a third value, colored by a colormap.
import matplotlib.pyplot as plt
import numpy as np

np.random.seed(9)
x = np.random.rand(60)
y = np.random.rand(60)
sizes = np.random.rand(60) * 400   # dot sizes
values = np.random.rand(60)        # colors

plt.scatter(x, y, s=sizes, c=values, cmap="plasma", alpha=0.7)
plt.colorbar(label="Value")

plt.title("Bubble Chart")
plt.xlabel("X")
plt.ylabel("Y")

plt.show()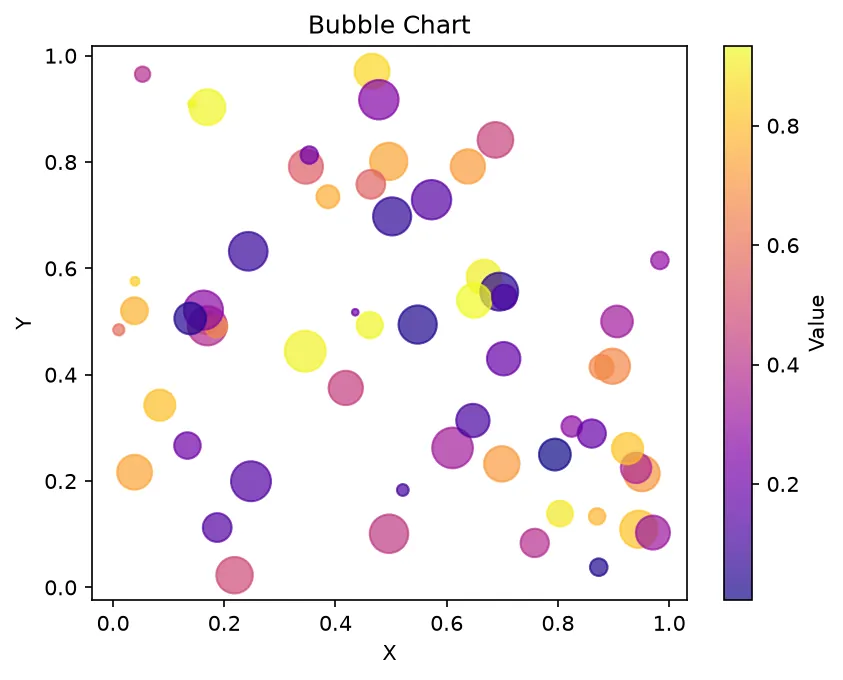
import matplotlib.pyplot as plt

hours = [1, 2, 3, 4, 5, 6]
score = [52, 55, 61, 68, 72, 79]
effort = [20, 35, 50, 65, 80, 95]

fig, ax = plt.subplots()
sc = ax.scatter(hours, score, s=effort, c=effort, cmap="viridis")
ax.set_xlabel("Hours studied")
ax.set_ylabel("Score")

print("Points:", len(sc.get_offsets()))
print("First point:", [int(v) for v in sc.get_offsets()[0]])
print("Sizes vary:", len(set(sc.get_sizes())) > 1)
print("Colormap:", sc.get_cmap().name)
print("X label:", ax.get_xlabel())
print("Collections on the axes:", len(ax.collections))

# ✅ Expected output:
# Points: 6
# First point: [1, 52]
# Sizes vary: True
# Colormap: viridis
# X label: Hours studied
# Collections on the axes: 1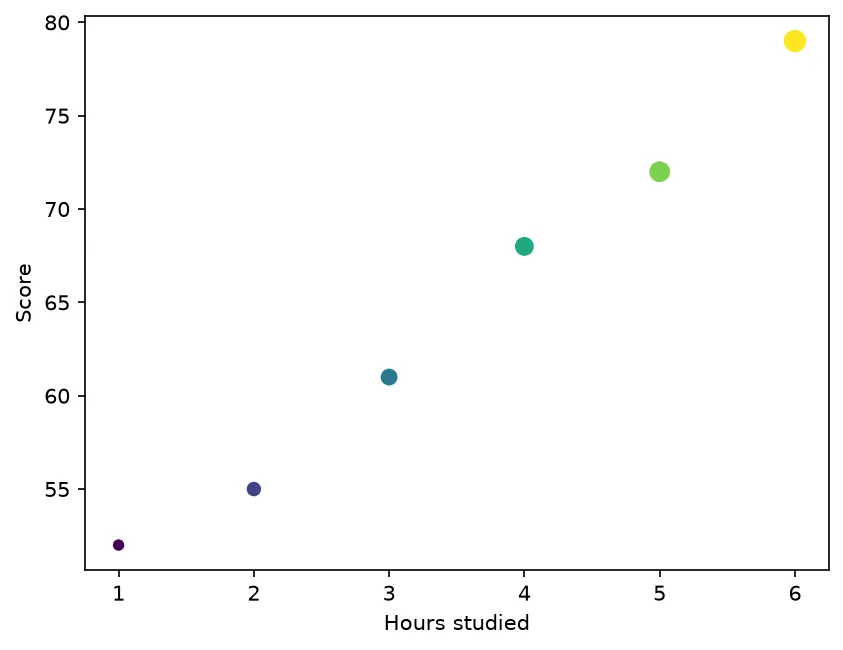
❓ Frequently Asked Questions
Lesson complete — you can reveal relationships in data!
You plotted x against y, customized dot size, shape and transparency, and encoded a third variable with color plus a colorbar.
Practice quiz
Which function draws one dot per observation?
- plt.scatter()
- plt.dots()
- plt.points()
- plt.cloud()
Answer: plt.scatter(). plt.scatter(x, y) places a dot at each (x, y) position.
Which argument controls the size of the dots?
- size=
- r=
- s=
- d=
Answer: s=. The s= argument sets dot size; an array sizes each dot individually.
Which argument colors each point by a value?
- color=
- c=
- tint=
- shade=
Answer: c=. Pass an array to c= so each dot is colored by its value.
Which argument selects the colormap?
- palette=
- colormap=
- cmap=
- scale=
Answer: cmap=. cmap= picks the colormap, e.g. cmap='viridis'.
What does alpha=0.5 do on a dense scatter plot?
- Doubles the dot size
- Makes overlaps reveal denser regions
- Hides every dot
- Changes the colormap
Answer: Makes overlaps reveal denser regions. alpha sets transparency so overlapping dots appear darker, revealing clusters.
Which call adds a legend mapping colors to values?
- plt.legend()
- plt.colorscale()
- plt.cbar()
- plt.colorbar()
Answer: plt.colorbar(). plt.colorbar() adds a bar showing how colors map to values.
Which marker= value draws triangles?
- 'o'
- 's'
- '*'
- '^'
Answer: '^'. marker='^' draws upward triangles; 'o' is a circle, 's' a square.
When is a scatter plot preferred over a line plot?
- When points are independent observations
- When data changes over time
- When you need a running total
- When showing percentages
Answer: When points are independent observations. Scatter plots reveal correlation between two variables for independent observations.
What error appears when x and y lengths differ?
- KeyError
- TypeError
- ValueError: x and y must be the same size
- IndexError
Answer: ValueError: x and y must be the same size. Every point needs both an x and a y, so unequal lengths raise a ValueError.
How do you encode a third variable as dot size (bubble chart)?
- Pass an array to s=
- Pass an array to alpha=
- Pass an array to marker=
- Pass an array to label=
Answer: Pass an array to s=. Passing an array to s= sizes each dot individually, making a bubble chart.
Continue this course
- Previous: Histograms
- Next: Pie Charts — Show parts of a whole with percentages, labels, and explode
- Quick reference: Matplotlib cheat sheet › Plot Types
Frequently asked questions
When should I use a scatter plot instead of a line plot?
Use a scatter plot when each data point is an independent observation and you want to see the relationship or correlation between two numeric variables. Use a line plot when the points are ordered, such as a value changing over time.
How do I change the size of the dots?
Pass the s= argument to plt.scatter(). A single number sizes every dot the same; an array sizes each dot individually, which lets you encode a third variable as point size — a so-called bubble chart.
How do I color points by a value?
Pass an array to the c= argument and pick a colormap with cmap=. Each point is colored according to its value in that array. Add plt.colorbar() to show the scale that maps colors back to numbers.
What does the alpha argument do on a scatter plot?
alpha sets transparency between 0 and 1. On dense scatter plots with many overlapping points, a value like alpha=0.5 reveals where points pile up because overlapping dots appear darker.