Tick Locators & Formatters
Reviewed & published by Brayan K
Tick locators decide where the marks on an axis go, while tick formatters decide how each mark's value is written — together they give you complete control over axis labels.
Part of the free Matplotlib course at LearnCodingFast — hands-on lessons with worked examples and the output they print, plus practice exercises and a quick quiz.
In this lesson you'll set ticks by hand, place them with MaxNLocator and MultipleLocator, reformat numbers with FuncFormatter and PercentFormatter, rotate crowded labels, and add minor ticks.
What You'll Learn in This Lesson
- Setting ticks by hand with set_xticks/set_xticklabels
- Placing ticks with MaxNLocator and MultipleLocator
- Reformatting numbers with FuncFormatter
- Percent and string-method formatters
- Rotating long labels so they don't overlap
- Adding minor ticks for a finer grid
1 Setting Ticks by Hand
The most direct approach: call ax.set_xticks() with the positions where ticks should sit, then ax.set_xticklabels() with the text for each. This is ideal when you plot against numeric positions but want friendly labels like month names underneath.
import matplotlib.pyplot as plt

months = ["Jan", "Feb", "Mar", "Apr", "May"]
sales = [120, 145, 130, 160, 175]

fig, ax = plt.subplots(figsize=(7, 4), constrained_layout=True)
ax.plot(range(5), sales, marker="o")

# Place ticks at positions 0..4, then label them with month names
ax.set_xticks(range(5))
ax.set_xticklabels(months)

ax.set_title("Monthly Sales")
ax.set_ylabel("Units")
plt.show()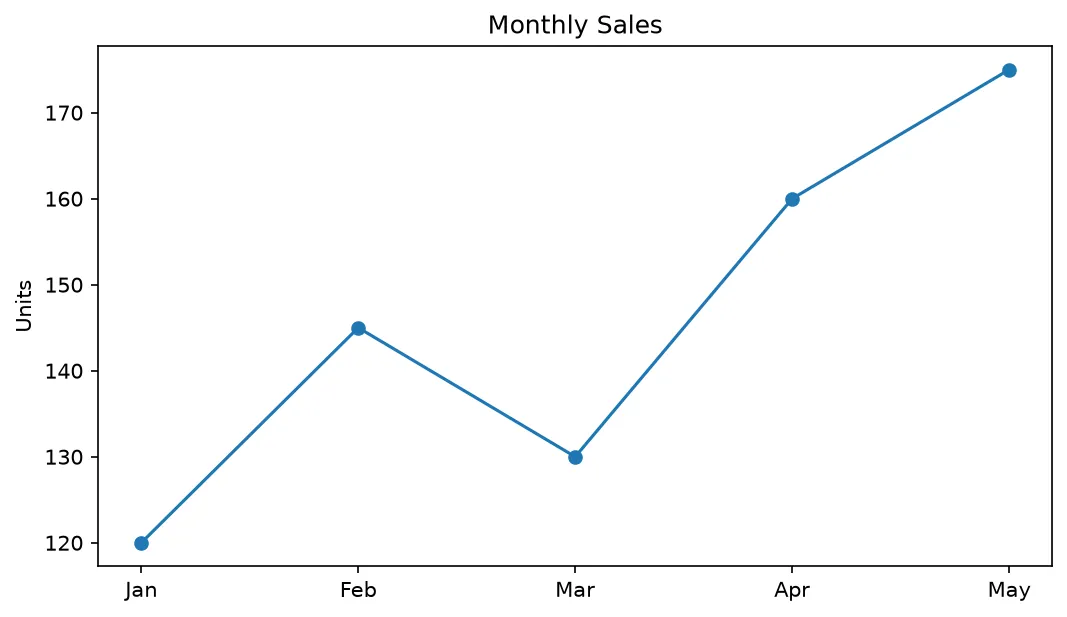
What you'll see: a five-point line of monthly sales rising overall, with the x-axis marked Jan through May instead of the raw numbers 0 to 4.
2 Locators: MultipleLocator & MaxNLocator
When the data range varies, hard-coding ticks is fragile. Locators place them by a rule instead. MultipleLocator(2) puts a tick at every multiple of 2, while MaxNLocator(5) picks at most five nicely rounded values. Both live in matplotlib.ticker and attach via ax.xaxis.set_major_locator().
import matplotlib.pyplot as plt
import numpy as np
from matplotlib.ticker import MultipleLocator, MaxNLocator

x = np.linspace(0, 20, 200)
y = np.sin(x)

fig, (ax1, ax2) = plt.subplots(2, 1, figsize=(8, 6), constrained_layout=True)

# Top: a tick every 2 units on x, every 0.5 on y
ax1.plot(x, y)
ax1.xaxis.set_major_locator(MultipleLocator(2))
ax1.yaxis.set_major_locator(MultipleLocator(0.5))
ax1.set_title("MultipleLocator: ticks at fixed steps")

# Bottom: at most 5 nicely-rounded ticks
ax2.plot(x, y, color="darkorange")
ax2.xaxis.set_major_locator(MaxNLocator(5))
ax2.set_title("MaxNLocator: at most 5 tidy ticks")

plt.show()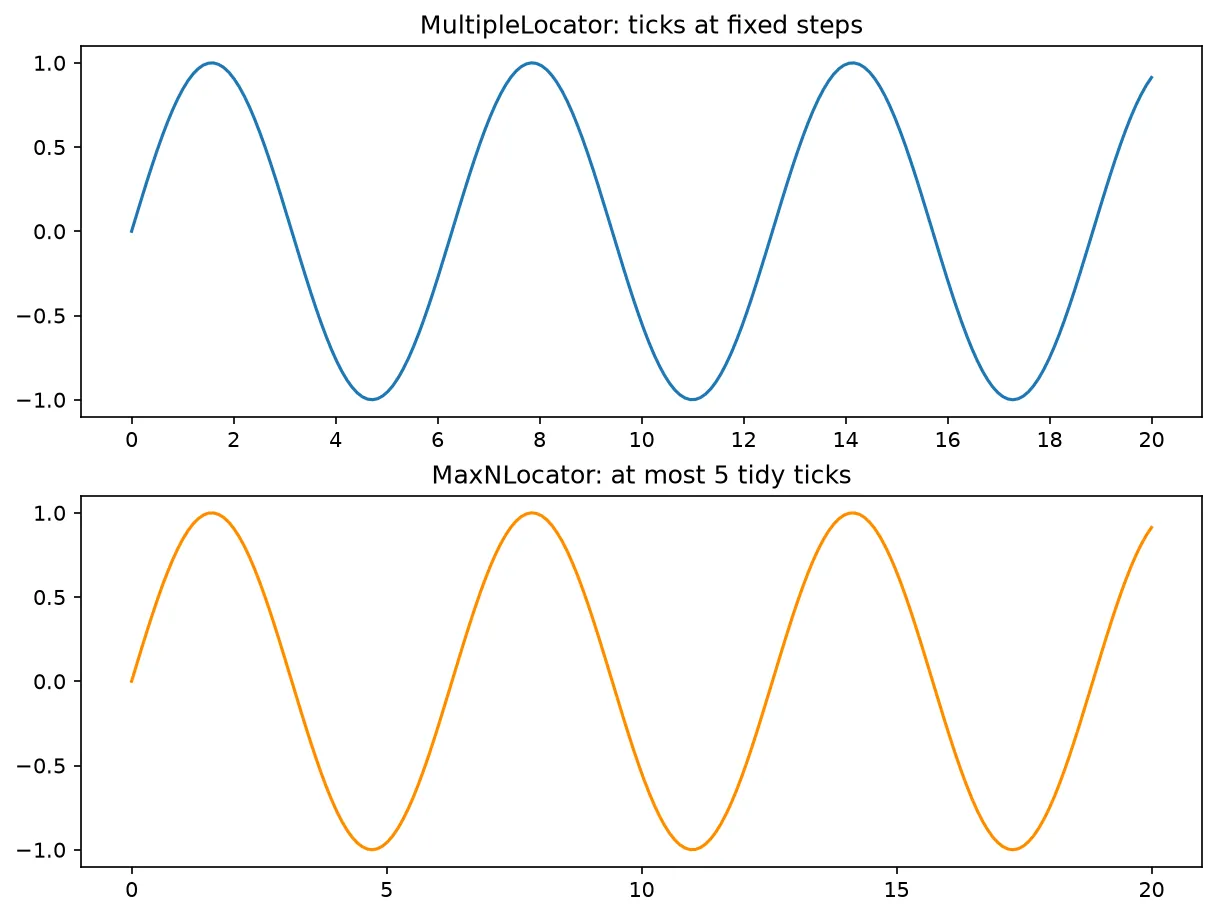
What you'll see: two sine waves. The top one has evenly stepped gridlike ticks every 2 units on x and 0.5 on y; the bottom one shows just a handful of clean, rounded x-ticks chosen automatically.
3 Formatters: Currency, Percent & More
A formatter rewrites each tick's number. PercentFormatter(xmax=1.0) turns 0.25 into 25%. FuncFormatter runs your own function on every value — perfect for currency. StrMethodFormatter("{x:,.0f}") applies a format string with thousands separators. Attach any of them with ax.yaxis.set_major_formatter().
What you'll see: two panels. The left bars have y-axis labels like $1,200 and $2,400; the right line has y-axis labels like 10% and 30% — the same numbers dressed up for their audience.
🎯 Your Turn: Fill in the Blanks
Replace each ___ to rotate the long day labels so they stop overlapping.
import matplotlib.pyplot as plt

days = ["Monday", "Tuesday", "Wednesday", "Thursday", "Friday"]
visits = [340, 280, 410, 390, 460]

fig, ax = plt.subplots(figsize=(7, 4), constrained_layout=True)
ax.bar(days, visits, color="steelblue")

# Put ticks under each bar, then rotate the labels 45 degrees
ax.set_xticks(range(5))
ax.set_xticklabels(days, rotation=___, ha="right")

ax.set_title("Daily Visits")
plt.show()
Hint: 45 degrees with ha="right" is the classic fix for crowded labels.
📋 Common Errors & Quick Reference
❌ Labels are shifted off their ticks
You set labels without matching positions. Call set_xticks(positions) first, then set_xticklabels(labels) with the same count.
❌ TypeError: FuncFormatter takes 2 arguments
Your formatter function must accept both value and position: lambda v, pos: ..., even if you ignore pos.
❌ ImportError on the locator/formatter
Import from the right module: from matplotlib.ticker import MultipleLocator, FuncFormatter, PercentFormatter.
| Tool | What It Does |
|---|---|
| MultipleLocator(n) | Tick at every multiple of n |
| MaxNLocator(k) | At most k tidy ticks |
| PercentFormatter() | Show values as percentages |
| FuncFormatter(fn) | Custom text from your function |
🏆 Mini Challenge: Major & Minor Ticks
Plot exponential growth with major ticks every 2 and minor ticks every 0.5, format the y-axis with thousands separators, and add a two-level grid.
import matplotlib.pyplot as plt
import numpy as np
from matplotlib.ticker import MultipleLocator, StrMethodFormatter

x = np.linspace(0, 10, 300)
y = np.exp(0.3 * x)

fig, ax = plt.subplots(figsize=(8, 5), constrained_layout=True)
ax.plot(x, y, color="crimson")

# Major ticks every 2, minor ticks every 0.5
ax.xaxis.set_major_locator(MultipleLocator(2))
ax.xaxis.set_minor_locator(MultipleLocator(0.5))

# Format y-axis numbers with thousands separators
ax.yaxis.set_major_formatter(StrMethodFormatter("{x:,.0f}"))

# Show a grid that uses both major and minor ticks
ax.grid(which="major", linestyle="-", alpha=0.5)
ax.grid(which="minor", linestyle=":", alpha=0.3)

ax.set_title("Growth with Major & Minor Ticks")
plt.show()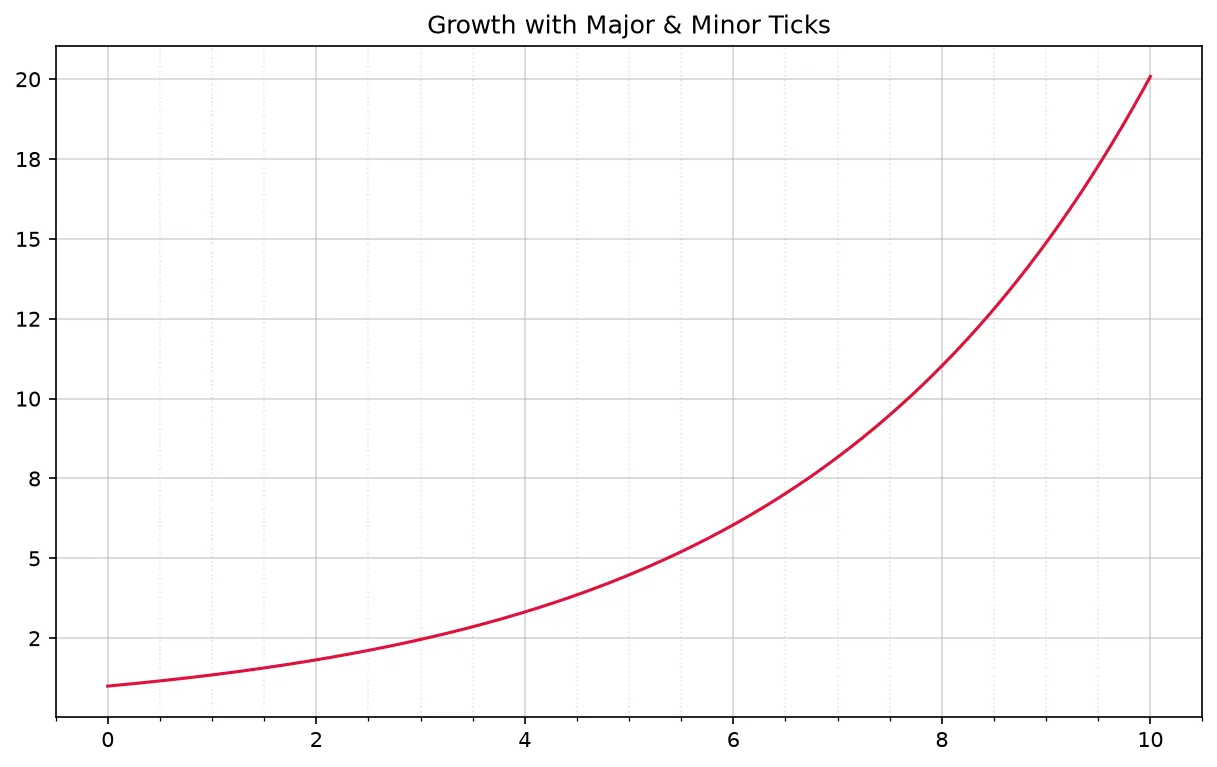
import matplotlib.pyplot as plt
from matplotlib.ticker import FuncFormatter

fig, ax = plt.subplots()
ax.plot([0, 1, 2, 3, 4], [0, 2500, 5000, 7500, 10000])

ax.yaxis.set_major_formatter(FuncFormatter(lambda v, pos: f"£{v:,.0f}"))
ax.set_xticks([0, 1, 2, 3, 4], labels=["Mon", "Tue", "Wed", "Thu", "Fri"])

fig.canvas.draw()

print("X tick labels:", [t.get_text() for t in ax.get_xticklabels()])
print("Y tick labels:", [t.get_text() for t in ax.get_yticklabels()])
print("Formatter used:", type(ax.yaxis.get_major_formatter()).__name__)
print("Locator after set_xticks:", type(ax.xaxis.get_major_locator()).__name__)
print("Number of x ticks:", len(ax.get_xticks()))

# ✅ Expected output:
# X tick labels: ['Mon', 'Tue', 'Wed', 'Thu', 'Fri']
# Y tick labels: ['£-2,000', '£0', '£2,000', '£4,000', '£6,000', '£8,000', '£10,000', '£12,000']
# Formatter used: FuncFormatter
# Locator after set_xticks: FixedLocator
# Number of x ticks: 5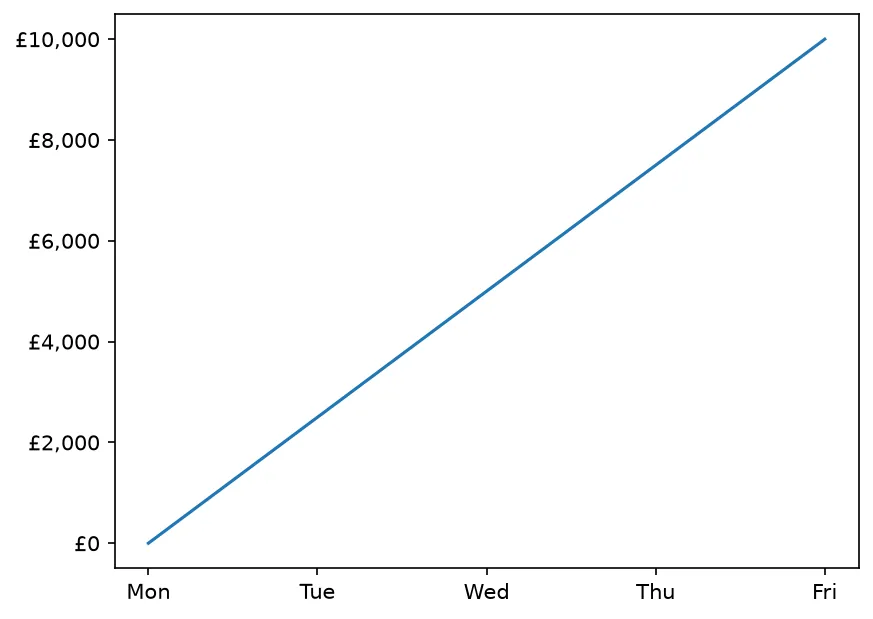
❓ Frequently Asked Questions
Lesson complete — your axes now say exactly what you mean!
You set ticks by hand, placed them with MultipleLocator and MaxNLocator, reformatted numbers with FuncFormatter and PercentFormatter, rotated long labels, and added minor ticks.
Practice quiz
What does a tick LOCATOR control?
- The chart's colormap
- The figure size
- How each tick number is written
- WHERE the ticks are placed on an axis
Answer: WHERE the ticks are placed on an axis. A locator decides where ticks go; a formatter decides how each is written.
Which pair sets tick positions and their text labels by hand?
- ax.ticks() and ax.labels()
- ax.set_locator() and ax.set_text()
- ax.set_xticks() and ax.set_xticklabels()
- ax.xticks() and ax.xlabels()
Answer: ax.set_xticks() and ax.set_xticklabels(). set_xticks(positions) then set_xticklabels(labels) places labels manually.
Which locator puts a tick at every multiple of a value?
- MaxNLocator(n)
- MultipleLocator(n)
- AutoLocator(n)
- FixedLocator(n)
Answer: MultipleLocator(n). MultipleLocator(2) places a tick at every multiple of 2.
What does MaxNLocator(5) do?
- Picks at most 5 nicely-rounded tick values
- Places exactly 5 random ticks
- Removes all but 5 data points
- Limits the axis to 5 units
Answer: Picks at most 5 nicely-rounded tick values. MaxNLocator(5) chooses at most five tidy, rounded tick values.
Which formatter turns 0.25 into 25%?
- FuncFormatter(xmax=1.0)
- StrMethodFormatter('%')
- ScalarFormatter()
- PercentFormatter(xmax=1.0)
Answer: PercentFormatter(xmax=1.0). PercentFormatter(xmax=1.0) renders fractions as percentages.
How many arguments must a FuncFormatter function accept?
- Zero
- Exactly one
- Two — the value and its position
- Three
Answer: Two — the value and its position. A FuncFormatter receives the value and its position; both must be in the signature.
Which module holds MultipleLocator and FuncFormatter?
- matplotlib.pyplot
- matplotlib.ticker
- matplotlib.axes
- matplotlib.scale
Answer: matplotlib.ticker. Locators and formatters live in matplotlib.ticker.
Which call attaches a locator to the x-axis?
- ax.xaxis.set_major_locator(loc)
- ax.set_locator(loc)
- ax.xticks(loc)
- ax.locator_x(loc)
Answer: ax.xaxis.set_major_locator(loc). ax.xaxis.set_major_locator() attaches the locator to the x-axis.
How do you stop long category labels from overlapping?
- Hide the x-axis entirely
- Make the figure smaller
- Use a logarithmic scale
- Rotate them, e.g. rotation=45, ha='right'
Answer: Rotate them, e.g. rotation=45, ha='right'. set_xticklabels(labels, rotation=45, ha='right') keeps crowded labels readable.
What does StrMethodFormatter('{x:,.0f}') add to numbers?
- Percent signs
- Thousands separators
- Scientific notation
- Currency symbols
Answer: Thousands separators. The format string {x:,.0f} adds thousands separators to each tick value.
Continue this course
- Previous: Displaying Images & Matrices (imshow)
- Next: Text, Math & LaTeX in Plots — Add annotations, arrows, and math with mathtext
- Quick reference: Matplotlib cheat sheet › Labels & Legends
Frequently asked questions
What is the difference between a locator and a formatter?
A locator decides WHERE ticks are placed on an axis — for example one every 2 units, or at most 5 tidy values. A formatter decides HOW each tick's number is written — as currency, a percentage, or with thousands separators. You usually set them with ax.xaxis.set_major_locator() and ax.xaxis.set_major_formatter().
When should I use set_xticks vs a locator?
set_xticks(positions) plus set_xticklabels(labels) is perfect when you have a small fixed set of labels, like month names. A locator such as MaxNLocator or MultipleLocator is better when the data range changes and you want ticks to follow a rule automatically rather than listing them by hand.
How do I format axis numbers as percentages or currency?
Use the ticker module. PercentFormatter(xmax=1.0) turns 0.25 into 25%. For currency or custom text, FuncFormatter(lambda v, pos: f'${v:,.0f}') runs your own function on every tick value. StrMethodFormatter('{x:,.0f}') adds thousands separators with a format string.
How do I rotate tick labels so they stop overlapping?
Long category names crowd the x-axis. Pass rotation to set_xticklabels, for example set_xticklabels(labels, rotation=45, ha='right'). The ha='right' alignment keeps each rotated label anchored neatly under its tick. plt.setp() and fig.autofmt_xdate() are alternatives for dates.