Adding Tables to Plots
Reviewed & published by Brayan K
A Matplotlib table renders a grid of values right inside a figure, letting you pair exact numbers with a chart so a dashboard shows both the visual trend and the precise data behind it.
Part of the free Matplotlib course at LearnCodingFast — hands-on lessons with worked examples and the output they print, plus practice exercises and a quick quiz.
In this lesson you'll build tables with ax.table(), add row and column labels, style individual cells, and place a table neatly below a chart.
What You'll Learn in This Lesson
- Building a table with ax.table()
- Supplying cellText, colLabels, and rowLabels
- Positioning a table with loc
- Tinting header cells with colColours
- Recoloring individual cells via get_celld()
- Placing a table below a chart for a dashboard
1 Your First Table
ax.table() turns a list of rows into a grid. Pass cellText — a list where each inner list is one row of strings — plus colLabels for the headers and a loc for placement. Because the table fills the axes, you usually hide the axes themselves with ax.axis('off').
import matplotlib.pyplot as plt

# Each inner list is one row of the table
rows = [
    ["Latte", "90", "$4.50"],
    ["Espresso", "65", "$3.00"],
    ["Mocha", "45", "$4.75"],
    ["Tea", "30", "$2.50"],
]

fig, ax = plt.subplots()
ax.axis("off")   # hide the plotting axes; the table is the content

table = ax.table(cellText=rows,
                 colLabels=["Drink", "Cups", "Price"],
                 loc="center")
table.scale(1, 1.6)   # make the rows a bit taller

ax.set_title("Cafe Sales", pad=20)

plt.show()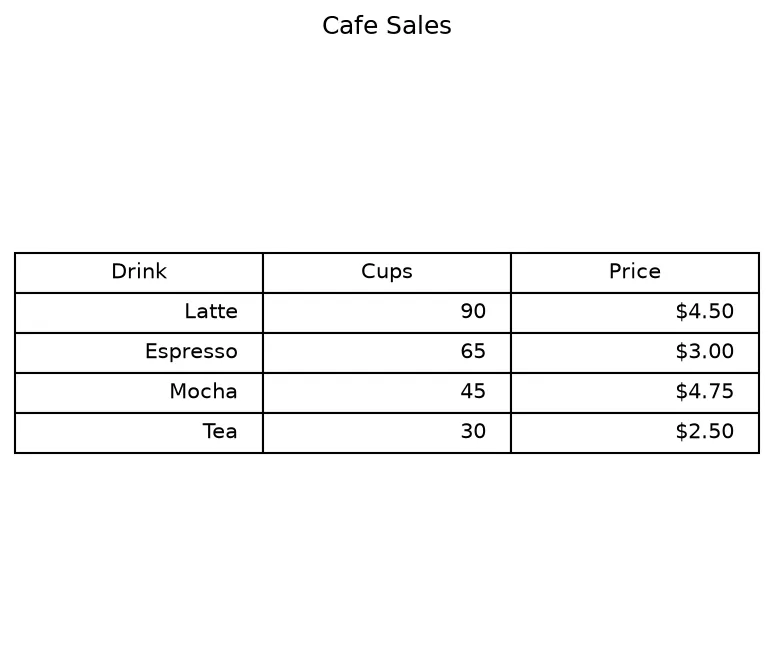
What you'll see: a clean three-column table of cafe sales — Drink, Cups, and Price — with a bold header row and four data rows, sitting centered in the figure with no axes around it.
2 Row Labels & Styled Cells
Add rowLabels for a header down the left side and tint headers with colColours/rowColours. To restyle one cell, fetch the cell map with table.get_celld() (keyed by (row, col), where row 0 is the header) and call set_facecolor() on the cell you want to highlight.
import matplotlib.pyplot as plt

data = [
    ["120", "150", "170"],
    ["90", "110", "130"],
    ["60", "75", "95"],
]
cols = ["Q1", "Q2", "Q3"]
rows = ["North", "South", "West"]

fig, ax = plt.subplots()
ax.axis("off")

table = ax.table(cellText=data,
                 colLabels=cols,
                 rowLabels=rows,
                 colColours=["#cfe8ff"] * 3,
                 rowColours=["#ffe0cc"] * 3,
                 loc="center")
table.scale(1, 1.7)

# Highlight the single biggest value (row 1, col 3 -> West Q3? no: North Q3)
cells = table.get_celld()
cells[(1, 2)].set_facecolor("#b6f5c3")   # data row 1, last column

ax.set_title("Regional Sales by Quarter", pad=20)

plt.show()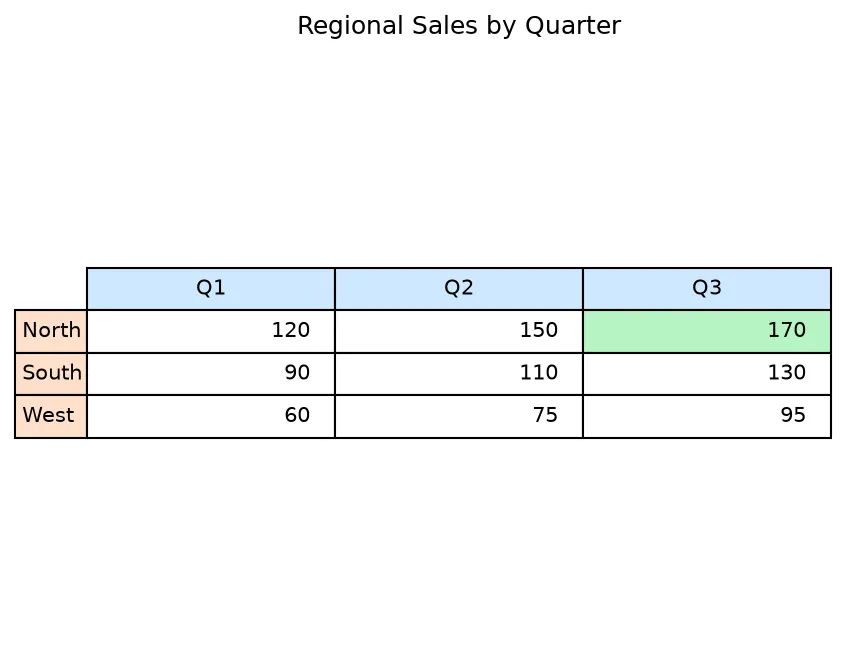
3 A Table Below a Chart
The dashboard classic: a chart on top and its data table underneath. Plot the chart, add the table with loc='bottom', hide the x tick labels so they do not clash with the table headers, and call plt.subplots_adjust(bottom=...) to make room.
import matplotlib.pyplot as plt
import numpy as np

months = ["Jan", "Feb", "Mar", "Apr"]
revenue = [120, 150, 130, 170]
costs = [80, 90, 85, 100]

x = np.arange(len(months))

fig, ax = plt.subplots()
ax.bar(x - 0.2, revenue, 0.4, label="Revenue")
ax.bar(x + 0.2, costs, 0.4, label="Costs")
ax.set_ylabel("$k")
ax.set_title("Monthly Revenue vs Costs")
ax.legend()

# Hide x labels so the table can carry them
ax.set_xticks([])

# The table underneath, sharing the columns with the bars
cell_text = [revenue, costs]
ax.table(cellText=[[str(v) for v in row] for row in cell_text],
         rowLabels=["Revenue", "Costs"],
         colLabels=months,
         loc="bottom")

# Make room at the bottom for the table
plt.subplots_adjust(left=0.2, bottom=0.2)

plt.show()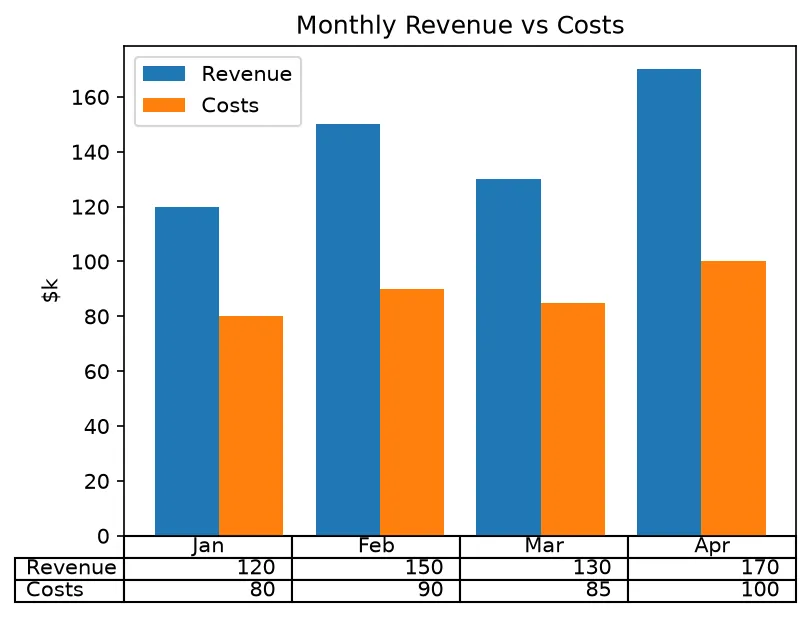
What you'll see: a grouped bar chart of revenue versus costs with a tidy two-row table directly underneath showing the exact monthly figures — a compact dashboard that pairs the visual with the numbers.
🎯 Your Turn: Fill in the Blanks
Replace each ___ to render a simple two-column table.
import matplotlib.pyplot as plt

rows = [
    ["Mercury", "0.39"],
    ["Earth", "1.00"],
    ["Mars", "1.52"],
]

fig, ax = plt.subplots()
ax.axis("off")

# Build the table with headers and center it
ax.___(cellText=rows,
       colLabels=["Planet", "AU from Sun"],
       loc="___")

ax.set_title("Distances", pad=20)

# Display the figure
plt.___()
📋 Common Errors & Quick Reference
❌ TypeError: must be str, not int
Cell values have to be strings. ✅ Convert with str(v) or a list comprehension: [[str(v) for v in row] for row in data].
❌ The bottom table is cut off
There is no room below the axes. ✅ Call plt.subplots_adjust(bottom=0.2) (and left= if you use rowLabels).
❌ colLabels length does not match rows
Every row needs the same number of columns as there are colLabels. ✅ Make all rows the same width.
| Argument / Call | What It Does |
|---|---|
| cellText=rows | The grid of cell strings |
| colLabels / rowLabels | Header cells across / down |
| loc='bottom' | Where the table sits |
| table.scale(w, h) | Resizes cells |
| table.get_celld()[(r,c)] | Access one cell to style it |
🎯 Mini-Challenge: A Scorecard
Build a table of three players' scores and color the header row gold.
import matplotlib.pyplot as plt

players = [
    ["Ana", "42", "Win"],
    ["Ben", "37", "Win"],
    ["Cara", "29", "Loss"],
]

fig, ax = plt.subplots()
ax.axis("off")

table = ax.table(cellText=players,
                 colLabels=["Player", "Score", "Result"],
                 loc="center")
table.scale(1, 1.8)

# Color the header row gold
for col in range(3):
    table.get_celld()[(0, col)].set_facecolor("gold")

ax.set_title("Match Scorecard", pad=20)

plt.show()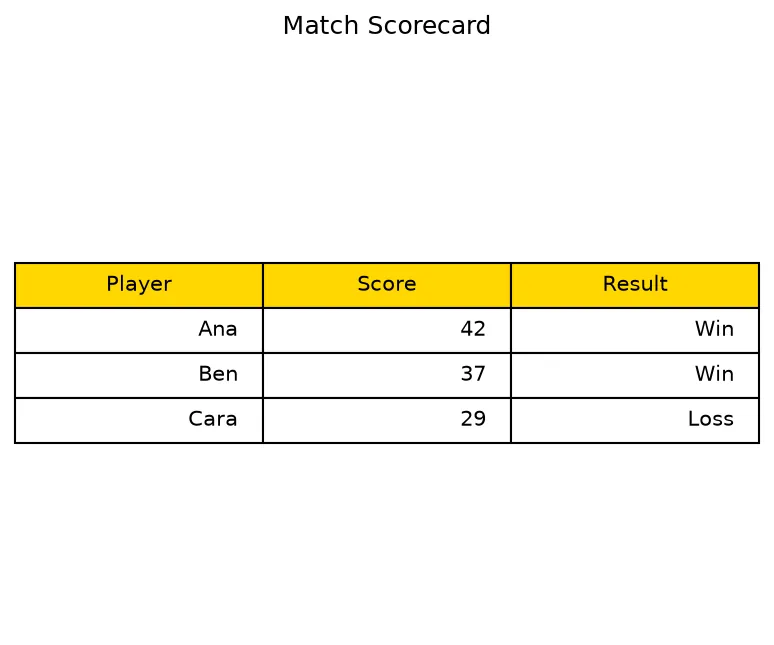
import matplotlib.pyplot as plt

rows = [["Mon", 12, 4], ["Tue", 15, 6], ["Wed", 9, 2]]
cols = ["Day", "Sold", "Returned"]

fig, ax = plt.subplots()
ax.axis("off")
tbl = ax.table(cellText=[[str(c) for c in r] for r in rows], colLabels=cols, loc="center")
tbl.auto_set_font_size(False)
tbl.set_fontsize(10)

cells = tbl.get_celld()
print("Cells including the header row:", len(cells))
print("Rows of data:", len(rows), "columns:", len(cols))
print("Header cell (0,0):", cells[(0, 0)].get_text().get_text())
print("First data cell (1,0):", cells[(1, 0)].get_text().get_text())
print("Total sold:", sum(r[1] for r in rows))
print("Axis is hidden so only the table shows:", not ax.axison)

# ✅ Expected output:
# Cells including the header row: 12
# Rows of data: 3 columns: 3
# Header cell (0,0): Day
# First data cell (1,0): Mon
# Total sold: 36
# Axis is hidden so only the table shows: True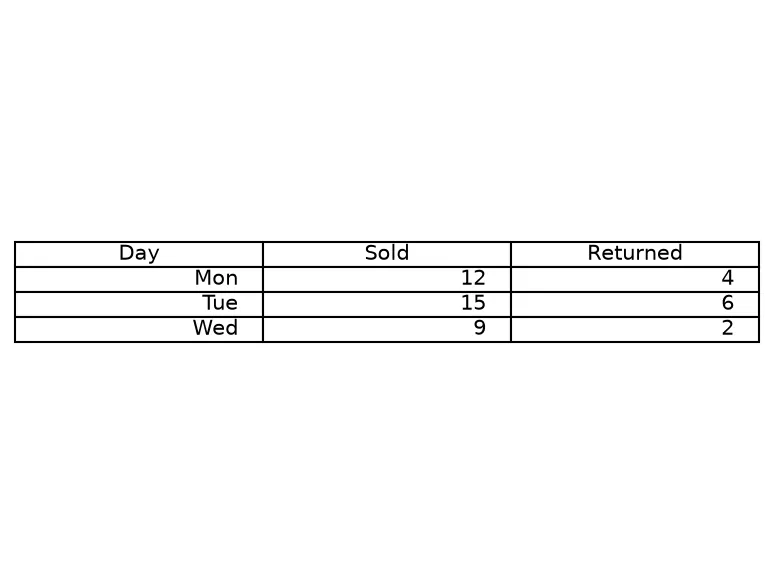
❓ Frequently Asked Questions
Lesson complete — your figures can show the numbers!
You built tables with ax.table, added row and column labels, recolored individual cells, and placed a data table beneath a chart for a dashboard look.
Practice quiz
Which argument supplies the grid of cell values to ax.table()?
- data=
- values=
- rows=
- cellText=
Answer: cellText=. cellText is a list of rows, each a list of strings, holding the table's cell values.
What type must every value in cellText be?
- A string
- An integer
- A float
- A NumPy array
Answer: A string. Every cell value must be a string; convert numbers with str() or an f-string.
Which argument adds header cells across the top of the table?
- rowLabels
- colLabels
- headers
- topLabels
Answer: colLabels. colLabels are the header cells across the top, one per column.
How do you place a table directly under a chart?
- loc='above'
- loc='center'
- loc='bottom'
- loc='under'
Answer: loc='bottom'. loc='bottom' positions the table beneath the axes.
What does table.get_celld() return?
- A list of column names
- The total cell count
- The figure object
- A dict of cells keyed by (row, col)
Answer: A dict of cells keyed by (row, col). get_celld() returns a dict keyed by (row, col) where row 0 is the header.
In get_celld(), which key is the FIRST data row, first column?
- (1, 0)
- (0, 0)
- (0, 1)
- (2, 1)
Answer: (1, 0). Row 0 is the header, so the first data row starts at (1, 0).
Which argument adds header cells down the LEFT side?
- sideLabels
- rowLabels
- leftLabels
- indexLabels
Answer: rowLabels. rowLabels are the header cells down the left side, one per row.
How do you make the table's rows taller?
- table.height(2)
- table.resize(2)
- table.scale(1, 1.6)
- table.stretch(1.6)
Answer: table.scale(1, 1.6). table.scale(width, height) scales the cells; a height > 1 makes rows taller.
How do you recolor a single cell's background?
- cell.color('red')
- cell.fill('red')
- cell.bg('red')
- cell.set_facecolor('red')
Answer: cell.set_facecolor('red'). Call set_facecolor() on the Cell you fetched from get_celld().
Why call plt.subplots_adjust(bottom=0.2) with a bottom table?
- To make room so the table is not cut off
- To rotate the table
- To delete the chart
- To change the colormap
Answer: To make room so the table is not cut off. It adds space below the axes so the loc='bottom' table fits.
Continue this course
- Previous: Managing Multiple Figures
- Next: Logarithmic & Symlog Scales — Reveal patterns across orders of magnitude with log axes
- Quick reference: Matplotlib cheat sheet
Frequently asked questions
How do I add a data table to a Matplotlib figure?
Call ax.table(cellText=rows, colLabels=headers, loc='bottom'). cellText is a list of rows where each row is a list of strings, colLabels are the column headers, and loc places the table — common values are 'bottom', 'center', 'top', and 'right'. The return value is a Table object you can style further.
What is the difference between rowLabels and colLabels?
colLabels are the header cells across the top, one per column. rowLabels are header cells down the left side, one per row. Supplying both gives a labeled grid like a spreadsheet; you can also pass colColours and rowColours to tint those header cells.
How do I style individual table cells?
Get the cell dictionary with the_table.get_celld(), which is keyed by (row, col) where row 0 is the column-header row. Each entry is a Cell you can recolor with set_facecolor(), change text with get_text().set_color(), or scale with the_table.scale(width, height) to make rows taller.
How do I put a table directly under a chart?
Plot your chart on the axes as usual, add the table with loc='bottom', then call plt.subplots_adjust(bottom=0.25) (or similar) to make room. Hiding the x tick labels with ax.set_xticks([]) avoids them clashing with the table's column headers underneath.