Managing Multiple Figures
Reviewed & published by Brayan K
Matplotlib can keep several figures open at once, and managing them means knowing how to create each one, switch which is current, save them separately, and close them to free memory.
Part of the free Matplotlib course at LearnCodingFast — hands-on lessons with worked examples and the output they print, plus practice exercises and a quick quiz.
In this lesson you'll create figures with plt.figure(), switch between them, grab the current one with plt.gcf(), save each separately, and close figures with plt.close().
What You'll Learn in This Lesson
- Creating numbered or named figures with plt.figure()
- Understanding the current figure
- Switching between figures by number or name
- Grabbing the current figure with plt.gcf()
- Saving each figure separately
- Closing figures with plt.close()
1 Creating & Switching Figures
Each call to plt.figure() makes a new figure and marks it as the current one, so plain plt.plot() and plt.title() commands draw onto it. Give figures a number or a name, and you can jump back to one by calling plt.figure(n) again — pyplot switches rather than creating a duplicate.
import matplotlib.pyplot as plt
import numpy as np

x = np.linspace(0, 10, 100)

# Figure 1: a sine wave
plt.figure("sine")
plt.plot(x, np.sin(x), color="crimson")
plt.title("Figure: sine")

# Figure 2: a cosine wave (now the current figure)
plt.figure("cosine")
plt.plot(x, np.cos(x), color="teal")
plt.title("Figure: cosine")

# Switch back to the first and add to it
plt.figure("sine")
plt.plot(x, np.sin(x) * 0.5, "--", color="orange")

print("Open figures:", plt.get_fignums())
plt.show()

# ✅ Expected output:
# Open figures: [1, 2]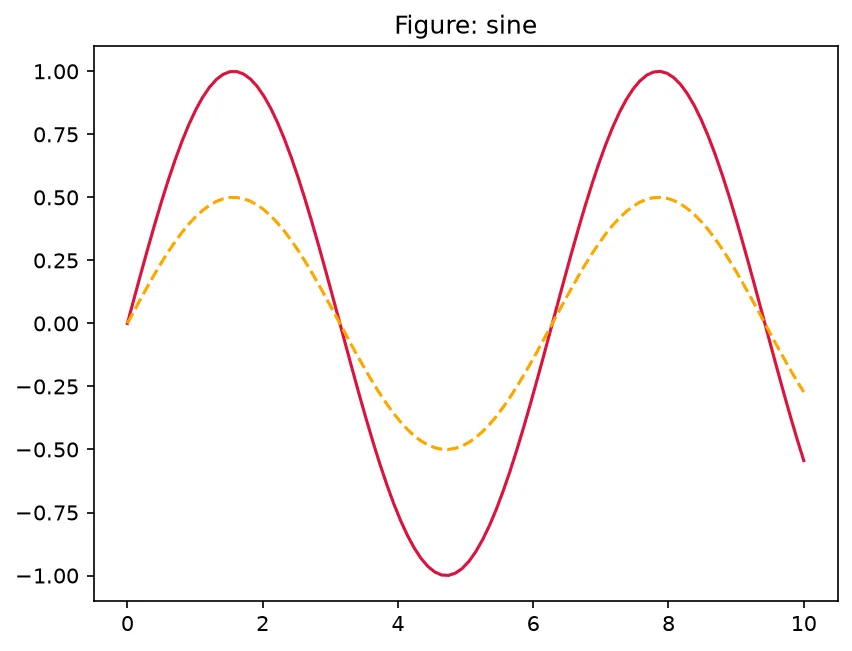
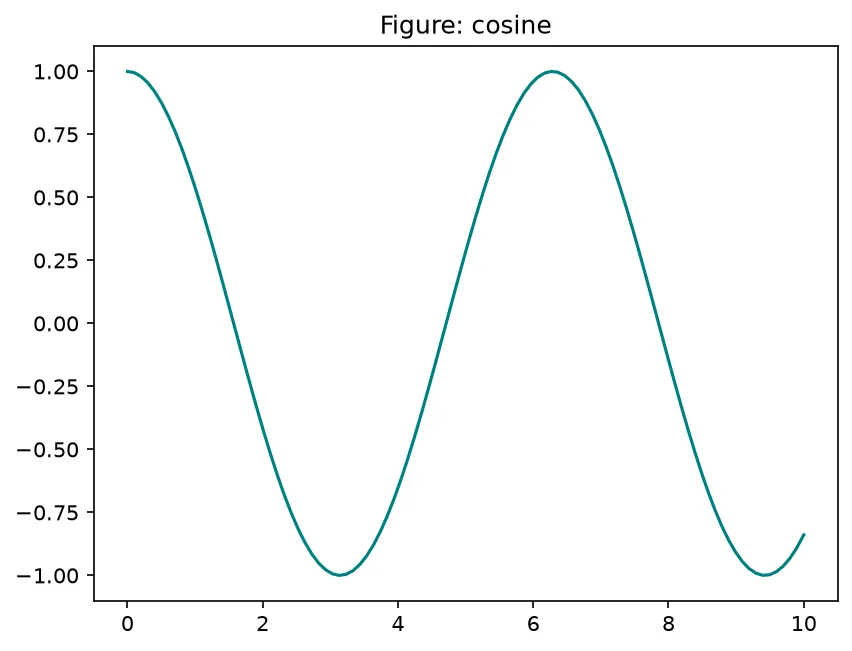
What you'll see: two separate figure windows — a crimson sine (with an added dashed orange half-sine) and a teal cosine — plus a printout of the open figure numbers proving both exist at once.
2 The Current Figure & gcf()
The pyplot state machine always has one current figure and axes. plt.gcf() ("get current figure") hands you that Figure object, and plt.gca() hands you the current axes — useful when you drew with state-machine commands but now need the real object to resize or save it. The explicit fig, ax = plt.subplots() style avoids the ambiguity entirely.
import matplotlib.pyplot as plt
import numpy as np

x = np.linspace(0, 5, 50)

# Draw with state-machine style
plt.figure()
plt.plot(x, x ** 2, color="purple")
plt.title("Quadratic")

# Grab the figure pyplot is currently using
fig = plt.gcf()
print("Current figure number:", fig.number)

# Now act on the real object
fig.set_size_inches(6, 4)
ax = plt.gca()
ax.set_xlabel("x")
ax.set_ylabel("x squared")

plt.show()

# ✅ Expected output:
# Current figure number: 1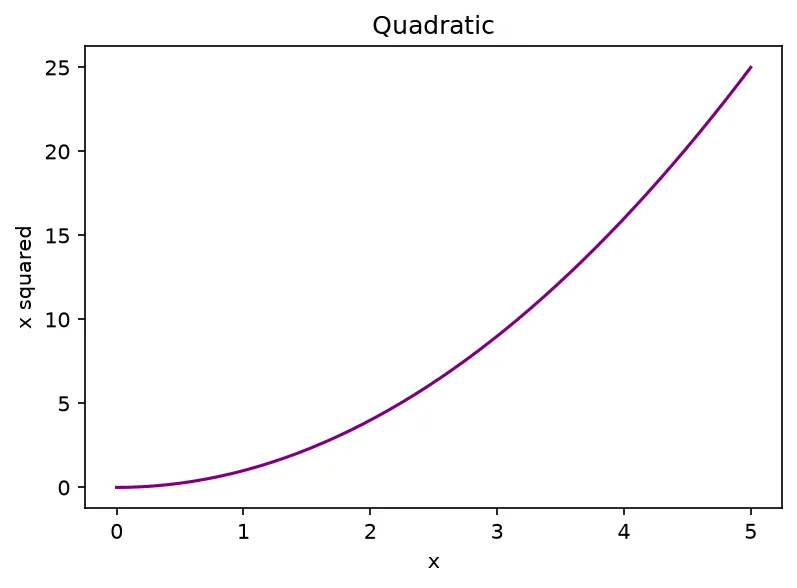
3 Saving Separately, Closing & fignum_exists
When you hold several Figure objects, save each with its own fig.savefig('name.png'). Close figures you no longer need with plt.close(fig), plt.close('all'), or plt.close(number) — vital inside loops, where unclosed figures pile up in memory. Check whether a figure is still open with plt.fignum_exists(n).
import matplotlib.pyplot as plt
import numpy as np
import tempfile, os

x = np.linspace(0, 10, 100)

# Build two independent figures, keeping the objects
fig1, ax1 = plt.subplots()
ax1.plot(x, np.sin(x))
ax1.set_title("Sine")

fig2, ax2 = plt.subplots()
ax2.plot(x, np.cos(x))
ax2.set_title("Cosine")

# Save each one separately
folder = tempfile.mkdtemp()
fig1.savefig(os.path.join(folder, "sine.png"))
fig2.savefig(os.path.join(folder, "cosine.png"))
print("Saved both figures to", folder)

# Close fig1, then check what is still open
plt.close(fig1)
print("fig1 still open?", plt.fignum_exists(fig1.number))
print("fig2 still open?", plt.fignum_exists(fig2.number))

# Tidy up the rest
plt.close("all")
print("After close('all'):", plt.get_fignums())
What you'll see: a printout confirming both PNGs were saved, then that fig1 is closed while fig2 is still open, and finally an empty list after close('all') clears everything.
🎯 Your Turn: Fill in the Blanks
Replace each ___ to make two figures and then close every figure.
import matplotlib.pyplot as plt

# Create figure number 1
plt.___(1)
plt.plot([1, 2, 3], [1, 4, 9])

# Create figure number 2
plt.figure(2)
plt.plot([1, 2, 3], [9, 4, 1])

print("Open before:", plt.get_fignums())

# Close every open figure
plt.close("___")

print("Open after:", plt.get_fignums())
📋 Common Errors & Quick Reference
❌ Everything lands on one figure
You never called plt.figure() between plots. ✅ Start each new figure with plt.figure() (or a fresh plt.subplots()).
❌ RuntimeWarning: More than 20 figures opened
A loop creates figures without closing them. ✅ Call plt.close(fig) at the end of each iteration.
❌ My plt commands drew on the wrong figure
pyplot targets the current figure. ✅ Call plt.figure(n) to switch first, or use explicit ax objects.
| Call | What It Does |
|---|---|
| plt.figure(n) | Creates or switches to a figure |
| plt.gcf() | Gets the current figure object |
| plt.get_fignums() | Lists open figure numbers |
| plt.fignum_exists(n) | Checks if a figure is still open |
| plt.close('all') | Closes every figure |
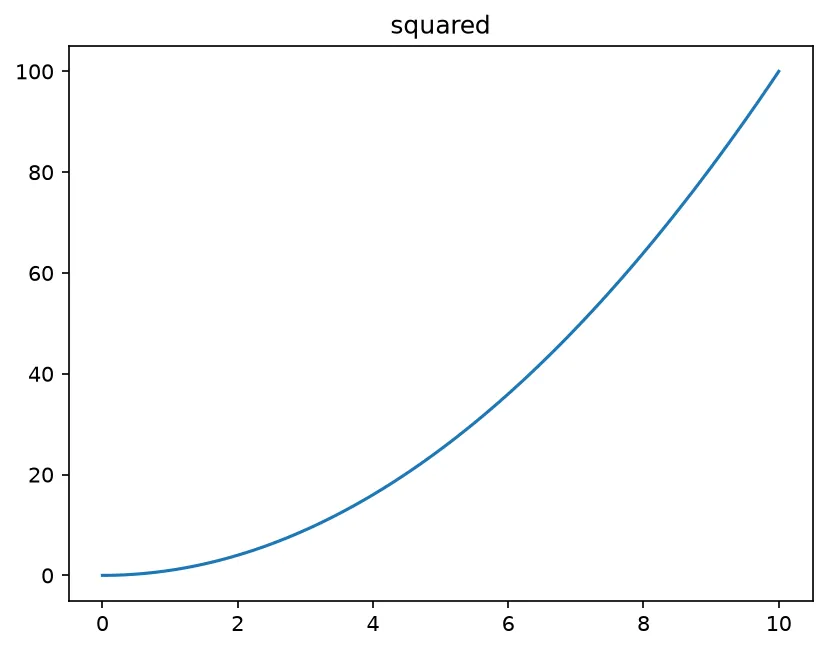
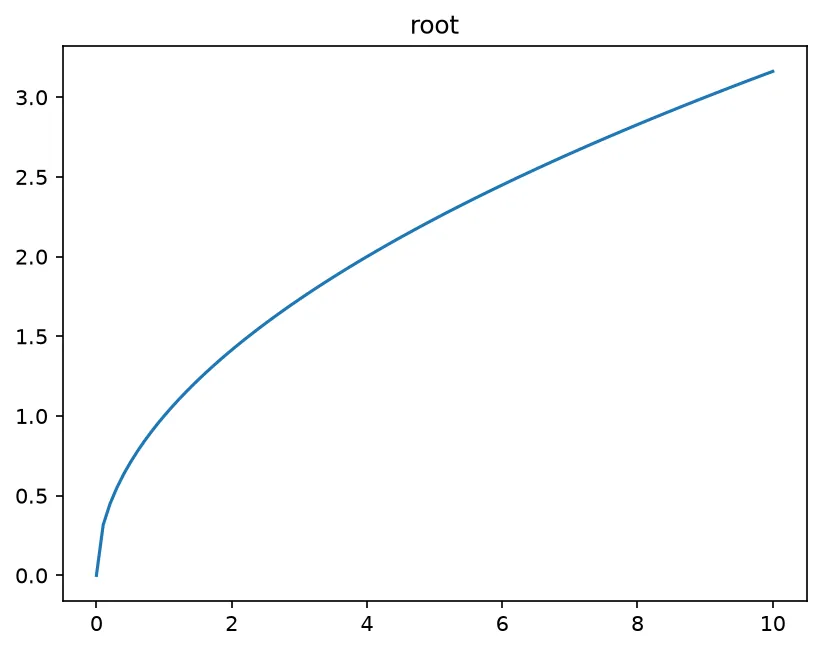
🎯 Mini-Challenge: One Figure Per Dataset
Loop over three datasets, give each its own figure and title, then report how many figures are open.
import matplotlib.pyplot as plt
import numpy as np

x = np.linspace(0, 10, 100)
datasets = {
    "linear": x,
    "squared": x ** 2,
    "root": np.sqrt(x),
}

# One figure per dataset
for name, y in datasets.items():
    plt.figure(name)
    plt.plot(x, y)
    plt.title(name)

print("Figures open:", plt.get_fignums())
print("Names:", [plt.figure(n).get_label() for n in plt.get_fignums()])

plt.show()

# ✅ Expected output:
# Figures open: [1, 2, 3]
# Names: ['linear', 'squared', 'root']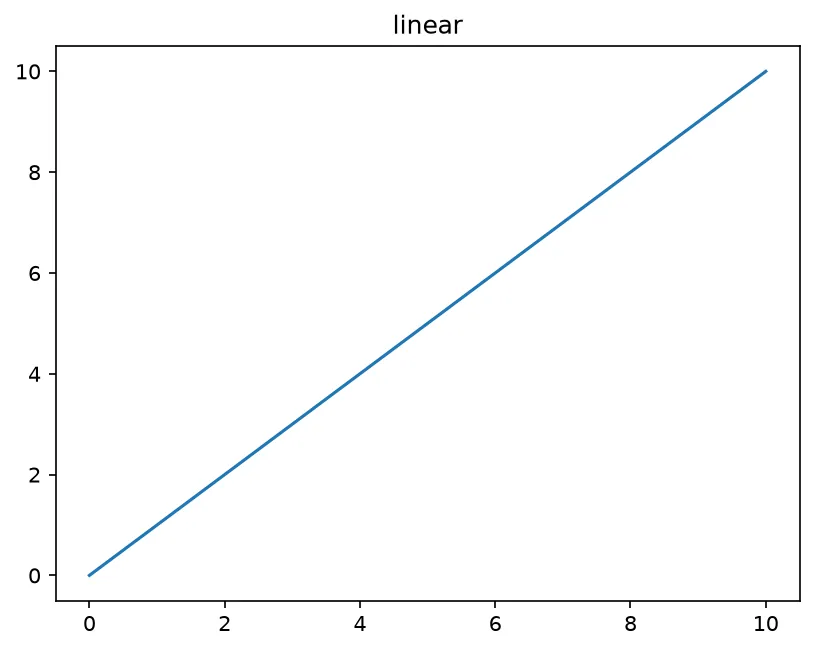
❓ Frequently Asked Questions
Lesson complete — you can juggle many figures!
You created numbered and named figures, switched between them, grabbed the current one with gcf, saved each separately, and closed them cleanly with close.
Practice quiz
What does each call to plt.figure() do?
- Creates a new figure and makes it current
- Clears all figures
- Shows the chart
- Saves the figure
Answer: Creates a new figure and makes it current. plt.figure() makes a new figure and marks it as the current one.
What happens if you call plt.figure(1) again after it already exists?
- It raises an error
- It deletes figure 1
- pyplot switches to figure 1 instead of duplicating it
- It renames the figure
Answer: pyplot switches to figure 1 instead of duplicating it. Calling plt.figure with an existing number switches to that figure rather than creating a new one.
Which call returns the current Figure object?
- plt.figure()
- plt.gcf()
- plt.current()
- plt.fig()
Answer: plt.gcf(). plt.gcf() ('get current figure') returns the active Figure object.
Which call returns the current Axes object?
- plt.axes_now()
- plt.gcf()
- plt.current_ax()
- plt.gca()
Answer: plt.gca(). plt.gca() ('get current axes') returns the active Axes.
Which call closes every open figure?
- plt.close('all')
- plt.clear()
- plt.reset()
- plt.delete()
Answer: plt.close('all'). plt.close('all') closes all open figures.
Which call lists the numbers of all open figures?
- plt.figures()
- plt.list()
- plt.get_fignums()
- plt.open()
Answer: plt.get_fignums(). plt.get_fignums() returns the list of open figure numbers.
Why close figures inside a loop that creates many of them?
- To change their color
- It is required for saving
- It speeds up plotting
- Open figures stay in memory and pile up
Answer: Open figures stay in memory and pile up. Unclosed figures accumulate in memory, so call plt.close(fig) each iteration.
Which call checks whether a figure number is still open?
- plt.is_open(n)
- plt.fignum_exists(n)
- plt.has_fig(n)
- plt.exists(n)
Answer: plt.fignum_exists(n). plt.fignum_exists(n) returns whether that figure is still open.
Why does naming figures (plt.figure('revenue')) help?
- It saves memory
- It logs the y-axis
- It is clearer than numbers when a script builds many
- It speeds up rendering
Answer: It is clearer than numbers when a script builds many. Named figures are easier to track than numbered ones in a busy script.
What does pyplot draw onto when you call plain plt.plot()?
- A random figure
- The first figure created
- All figures at once
- The current figure
Answer: The current figure. State-machine pyplot commands target the current figure and axes.
Continue this course
- Previous: Interactive Event Handling
- Next: Adding Tables to Plots — Embed a data table beneath or beside a chart
- Quick reference: Matplotlib cheat sheet › Basics
Frequently asked questions
How do I create more than one figure at the same time?
Call plt.figure() multiple times, optionally with a number or name: plt.figure(1) and plt.figure(2), or plt.figure('sales') and plt.figure('costs'). Each call creates a separate figure window. Whichever you called most recently is the current figure, and pyplot commands like plt.plot() draw onto it.
What does plt.gcf() do?
plt.gcf() returns the 'get current figure' object — the figure that pyplot commands currently target. It is handy when you used the state-machine style (plt.plot, plt.title) but now need the actual Figure object, for example to save it or change its size. Its sibling plt.gca() returns the current axes.
How do I switch which figure is active?
Call plt.figure(n) again with an existing number or name. Rather than creating a new figure, pyplot makes that one current, so subsequent plt commands draw onto it. This lets you interleave drawing on figure 1 and figure 2 within the same script.
How do I close figures to free memory?
Use plt.close(): plt.close(fig) closes a specific figure, plt.close('all') closes every open figure, and plt.close() closes the current one. Closing matters in loops that create many figures, because open figures stay in memory until closed and can pile up quickly.