Interactive Event Handling
Reviewed & published by Brayan K
Event handling lets a Matplotlib figure react to the user — connecting callback functions that fire on mouse clicks, mouse motion, and key presses so a static chart becomes an interactive tool.
Part of the free Matplotlib course at LearnCodingFast — hands-on lessons with worked examples and the output they print, plus practice exercises and a quick quiz.
In this lesson you'll connect callbacks with fig.canvas.mpl_connect(), read click positions from event.xdata/event.ydata, handle key presses, and pick the artist a user clicks.
What You'll Learn in This Lesson
- Connecting callbacks with fig.canvas.mpl_connect()
- Handling 'button_press_event' clicks
- Reading event.xdata and event.ydata
- Responding to 'key_press_event'
- Tracking the cursor with 'motion_notify_event'
- Picking artists with 'pick_event'
1 Connecting a Click Callback
The hub of interactivity is fig.canvas.mpl_connect(event_name, callback). You name the event you care about and hand it a function. Matplotlib calls that function with an event object each time it happens. For a click the event is 'button_press_event', and the click position in data units is event.xdata, event.ydata.
import matplotlib.pyplot as plt

fig, ax = plt.subplots()
ax.set_xlim(0, 10)
ax.set_ylim(0, 10)
ax.set_title("Click anywhere to drop a red dot")

# This callback fires on every mouse click — in a live window
def on_click(event):
    if event.inaxes:
        ax.plot(event.xdata, event.ydata, "ro")
        fig.canvas.draw()

# Wire the callback to click events
cid = fig.canvas.mpl_connect("button_press_event", on_click)
print("Connected click handler, id =", cid)

plt.show()

# ✅ Expected output:
# Connected click handler, id = 12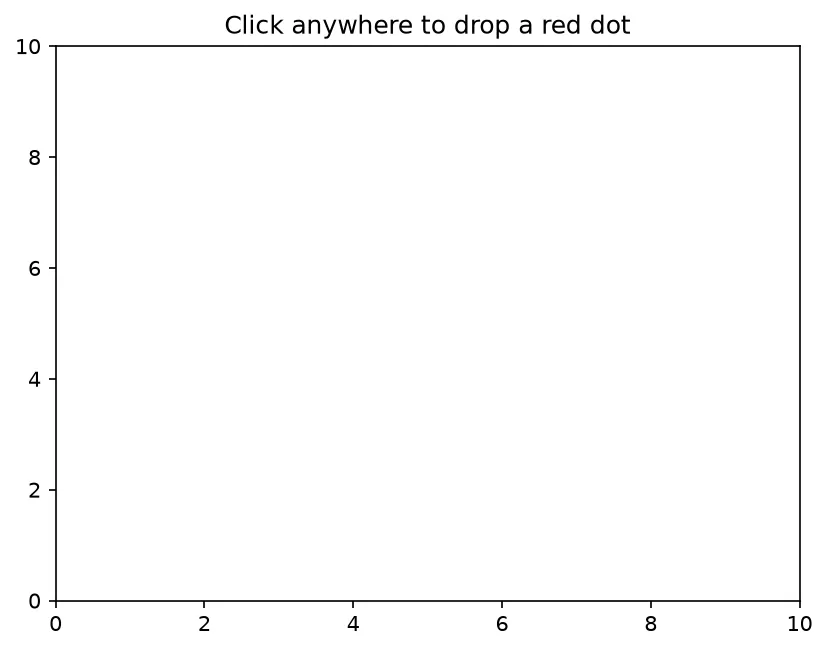
What you'll see here: an empty 10×10 grid and a printed confirmation that the handler is connected. Run it locally and every click drops a red dot exactly where you pressed.
2 Key Presses & Mouse Motion
The same mpl_connect pattern handles other events. 'key_press_event' gives you event.key (the character or name like 'up' or 'enter'), and 'motion_notify_event' fires continuously as the mouse moves, so you can show a live readout of the cursor position.
import matplotlib.pyplot as plt
import numpy as np

x = np.linspace(0, 2 * np.pi, 200)
fig, ax = plt.subplots()
(line,) = ax.plot(x, np.sin(x), color="purple")
ax.set_title("Press up/down to change frequency")

freq = {"f": 1}

# Key press redraws the curve at a new frequency
def on_key(event):
    if event.key == "up":
        freq["f"] += 1
    elif event.key == "down":
        freq["f"] = max(1, freq["f"] - 1)
    line.set_ydata(np.sin(freq["f"] * x))
    ax.set_title(f"frequency = {freq['f']}")
    fig.canvas.draw_idle()

# Motion shows the live cursor position
def on_move(event):
    if event.inaxes:
        ax.set_xlabel(f"cursor x={event.xdata:.2f}")
        fig.canvas.draw_idle()

fig.canvas.mpl_connect("key_press_event", on_key)
fig.canvas.mpl_connect("motion_notify_event", on_move)
print("Key and motion handlers connected")

plt.show()

# ✅ Expected output:
# Key and motion handlers connected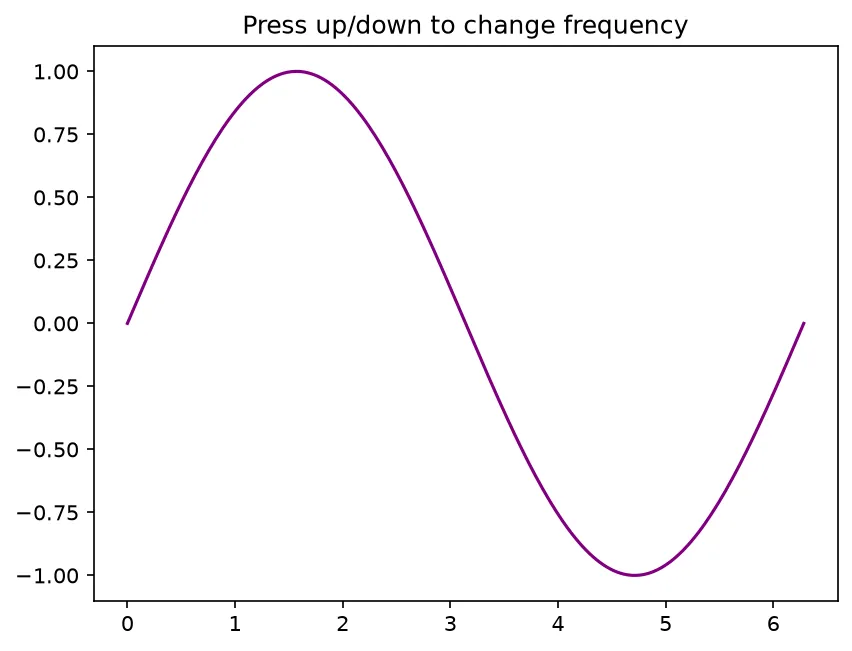
3 Picking the Clicked Artist
Sometimes you do not just want the click position — you want to know which point or line was clicked. Plot with picker=True (or a pixel tolerance) and connect to 'pick_event'. The callback receives event.artist (what was picked) and event.ind (the indices of the nearest data points).
import matplotlib.pyplot as plt
import numpy as np

rng = np.random.default_rng(7)
x = rng.uniform(0, 10, 25)
y = rng.uniform(0, 10, 25)

fig, ax = plt.subplots()
# picker=5 means "pick if click is within 5 points"
sc = ax.scatter(x, y, s=80, picker=5)
ax.set_title("Click a point to select it (live window)")

# Fires when the user clicks near a point
def on_pick(event):
    idx = event.ind[0]
    print(f"Picked point {idx}: ({x[idx]:.2f}, {y[idx]:.2f})")
    ax.set_title(f"Selected point {idx}")
    fig.canvas.draw_idle()

fig.canvas.mpl_connect("pick_event", on_pick)
print("Pick handler connected to", len(x), "points")

plt.show()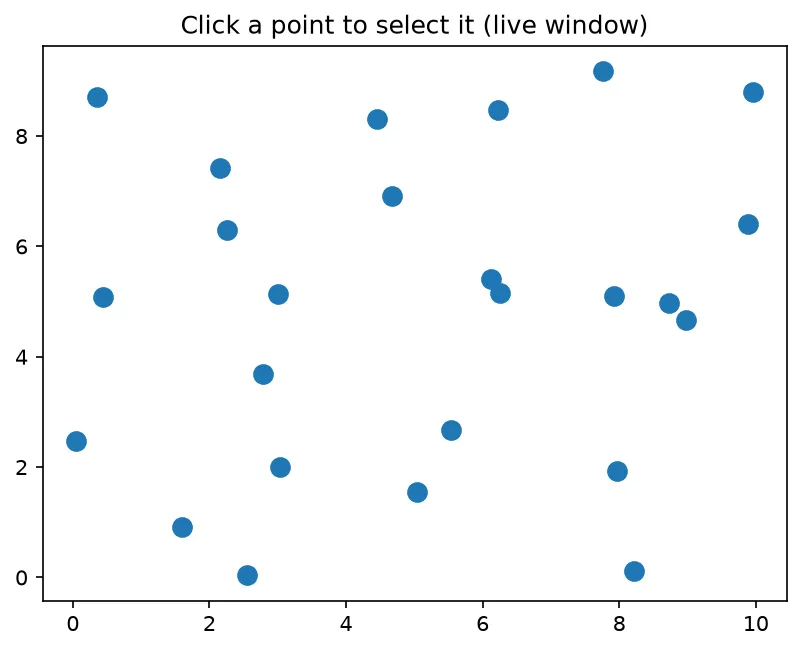
What you'll see here: a static scatter of 25 points and a printed confirmation. In a live window, clicking near any point prints its index and coordinates and updates the title.
🎯 Your Turn: Fill in the Blanks
Replace each ___ to connect a click handler that prints where you clicked.
import matplotlib.pyplot as plt

fig, ax = plt.subplots()
ax.set_xlim(0, 5)
ax.set_ylim(0, 5)

def on_click(event):
    if event.inaxes:
        # Print the click position in data coordinates
        print(event.___, event.ydata)

# Connect on_click to mouse-button presses
fig.canvas.___("button_press_event", on_click)

# Display the figure
plt.___()
📋 Common Errors & Quick Reference
❌ Nothing happens when I click
You are on a non-interactive backend. ✅ Run locally with a GUI backend (TkAgg/Qt); inline or headless backends never deliver events.
❌ TypeError: unsupported format for None
The click was outside the axes, so xdata is None. ✅ Guard with if event.inaxes: before using the coordinates.
❌ My new points never show up
You changed the data but did not refresh. ✅ Call fig.canvas.draw() or draw_idle() at the end of the callback.
| Event name | Fires when… |
|---|---|
| button_press_event | A mouse button is pressed |
| motion_notify_event | The mouse moves |
| key_press_event | A key is pressed |
| pick_event | A pickable artist is clicked |
| scroll_event | The scroll wheel turns |
🎯 Mini-Challenge: A Click Counter
Build a figure whose title counts how many times the user has clicked inside the axes.
import matplotlib.pyplot as plt

fig, ax = plt.subplots()
ax.set_xlim(0, 10)
ax.set_ylim(0, 10)

state = {"count": 0}

# Each click bumps the counter and re-titles the plot
def on_click(event):
    if event.inaxes:
        state["count"] += 1
        ax.plot(event.xdata, event.ydata, "g^")
        ax.set_title(f"Clicks: {state['count']}")
        fig.canvas.draw_idle()

ax.set_title("Clicks: 0")
fig.canvas.mpl_connect("button_press_event", on_click)
print("Click counter ready")

plt.show()

# ✅ Expected output:
# Click counter ready
❓ Frequently Asked Questions
Lesson complete — your figures can listen!
You connected callbacks with mpl_connect, handled clicks, key presses, and mouse motion, read positions from event.xdata/ydata, and picked the artist a user clicked.
Practice quiz
Which method connects a callback to figure events?
- fig.canvas.mpl_connect()
- fig.on_event()
- ax.connect()
- plt.bind()
Answer: fig.canvas.mpl_connect(). fig.canvas.mpl_connect(event_name, callback) wires a function to a named event.
Which event name fires when a mouse button is pressed?
- click_event
- button_press_event
- mouse_down
- press_event
Answer: button_press_event. 'button_press_event' fires every time a mouse button is pressed inside the figure.
Inside a callback, where is the click position in data coordinates?
- event.x and event.y (pixels)
- event.xdata and event.ydata
- event.col and event.row
- event.pos
Answer: event.xdata and event.ydata. event.xdata and event.ydata give the click translated into the plot's data coordinates.
What does event.inaxes let you check?
- The figure DPI
- Whether the click landed inside an Axes
- The mouse button number
- The backend name
Answer: Whether the click landed inside an Axes. Guarding with 'if event.inaxes' avoids None xdata/ydata when a click misses the axes.
Which event reports a pressed key in event.key?
- type_event
- char_event
- key_press_event
- input_event
Answer: key_press_event. 'key_press_event' delivers the pressed key (like 'up' or 'enter') in event.key.
Which event fires continuously as the mouse moves?
- motion_notify_event
- drag_event
- move_event
- hover_event
Answer: motion_notify_event. 'motion_notify_event' fires as the cursor moves, ideal for a live readout.
How do you make an artist clickable for pick_event?
- clickable=True
- selectable=True
- picker=True (or a tolerance)
- pickable=1
Answer: picker=True (or a tolerance). Plot with picker=True (or a pixel tolerance) to enable picking, then connect 'pick_event'.
In a pick callback, which attribute is the clicked artist?
- event.target
- event.artist
- event.object
- event.line
Answer: event.artist. event.artist is the line or marker that was picked; event.ind lists nearby indices.
Why might clicks do nothing in a headless or inline backend?
- The figure is too small
- Events need a live GUI backend and window
- mpl_connect is deprecated
- The callback must return True
Answer: Events need a live GUI backend and window. Interactive events require a live GUI backend (TkAgg/Qt); inline/headless backends draw static images.
Which call efficiently schedules a redraw for frequent updates?
- fig.canvas.draw_idle()
- fig.refresh()
- plt.redraw()
- ax.update()
Answer: fig.canvas.draw_idle(). draw_idle() schedules a redraw efficiently instead of forcing one on every event.
Continue this course
- Previous: Drawing Shapes (Patches)
- Next: Managing Multiple Figures — Juggle several figures, the current figure, and closing them
- Quick reference: Matplotlib cheat sheet
Frequently asked questions
How do I make a Matplotlib plot respond to mouse clicks?
Connect a callback to the figure's canvas with fig.canvas.mpl_connect('button_press_event', on_click). Matplotlib calls your on_click(event) function every time the user presses a mouse button inside the figure, passing an event object that carries the click location and which button was used.
What are event.xdata and event.ydata?
They are the click position translated into your plot's data coordinates — the actual x and y values where the user clicked, not pixels. If the click lands outside any axes they are None, so always check 'if event.inaxes' before using them.
Why does nothing happen when I run event code in a notebook or web runner?
Interactive events need a live GUI backend (like TkAgg or Qt) and a real window to click in. Headless or inline backends draw a static image, so the figure renders fine but clicks never fire. Run the script locally with a GUI backend, or use %matplotlib widget in Jupyter, to see callbacks respond.
How do I detect which artist the user clicked on?
Enable picking by passing picker=True (or a tolerance in points) when you plot, then connect to 'pick_event'. In the callback, event.artist is the line or marker that was picked and event.ind lists the indices of the nearest data points, so you can highlight or report exactly what was selected.