Drawing Shapes (Patches)
Reviewed & published by Brayan K
Patches are filled geometric shapes — rectangles, circles, polygons, and arrows — that you place directly on an axes to highlight regions, draw diagrams, or annotate your data with custom graphics.
Part of the free Matplotlib course at LearnCodingFast — hands-on lessons with worked examples and the output they print, plus practice exercises and a quick quiz.
In this lesson you'll add shapes with ax.add_patch(), control fill and outline with facecolor/edgecolor/alpha, draw arrows, and batch many shapes with a PatchCollection.
What You'll Learn in This Lesson
- Importing shapes from matplotlib.patches
- Adding a shape with ax.add_patch()
- Setting facecolor, edgecolor, and alpha
- Drawing arrows with FancyArrow
- Highlighting a region behind your data
- Batching shapes with a PatchCollection
1 Rectangles, Circles & add_patch
Patches live in the matplotlib.patches module. Build a shape, then call ax.add_patch() to place it. A Rectangle takes its bottom-left corner plus a width and height; a Circle takes a center and a radius. Patches do not auto-scale the view, so set the limits yourself.
import matplotlib.pyplot as plt
from matplotlib.patches import Rectangle, Circle

fig, ax = plt.subplots()

# A rectangle at (1, 1), 3 wide and 2 tall
ax.add_patch(Rectangle((1, 1), 3, 2,
             facecolor="skyblue", edgecolor="navy"))

# A circle centered at (6, 4) with radius 1.5
ax.add_patch(Circle((6, 4), 1.5,
             facecolor="salmon", edgecolor="darkred"))

# Patches do not set the view for you
ax.set_xlim(0, 9)
ax.set_ylim(0, 6)
ax.set_aspect("equal")
ax.set_title("A Rectangle and a Circle")

plt.show()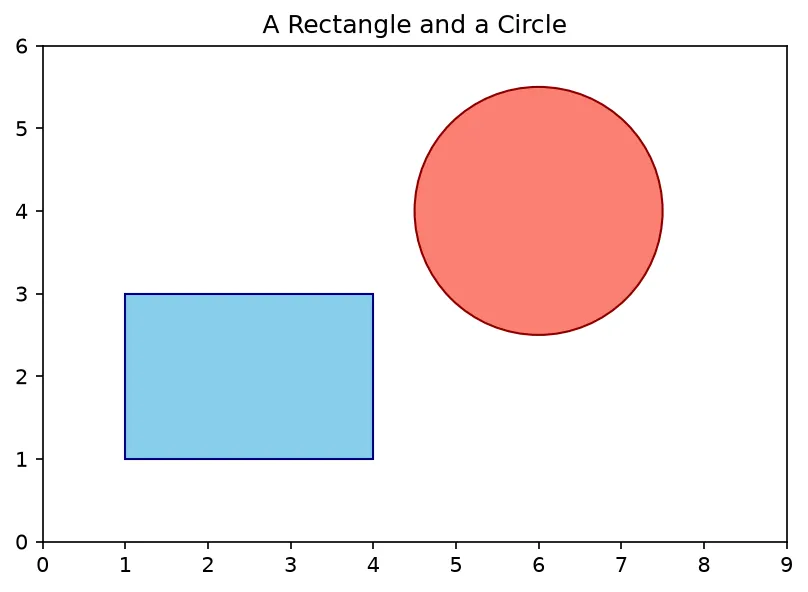
What you'll see: a sky-blue rectangle with a navy outline on the left and a salmon circle with a dark-red outline on the right, both correctly proportioned because the aspect ratio is locked.
2 Polygons, Arrows & Highlighting Regions
A Polygon takes an array of corner points, and a FancyArrow draws an arrow from a base point along a direction. A translucent Rectangle behind your data (low alpha) is a clean way to shade a region of interest without hiding the line.
import matplotlib.pyplot as plt
import numpy as np
from matplotlib.patches import Polygon, FancyArrow, Rectangle

x = np.linspace(0, 10, 200)
y = np.sin(x) + 1.5

fig, ax = plt.subplots()
ax.plot(x, y, color="black")

# Shade the region x = 3..6 behind the curve
ax.add_patch(Rectangle((3, 0), 3, 3,
             facecolor="gold", alpha=0.25))

# A triangle marker
tri = Polygon([[7.5, 2.2], [8.0, 2.8], [8.5, 2.2]],
              closed=True, facecolor="seagreen")
ax.add_patch(tri)

# An arrow pointing at the first peak
ax.add_patch(FancyArrow(1.0, 0.4, 0.5, 1.0,
             width=0.04, color="crimson",
             length_includes_head=True))

ax.set_xlim(0, 10)
ax.set_ylim(0, 3)
ax.set_title("Shapes Annotating a Curve")

plt.show()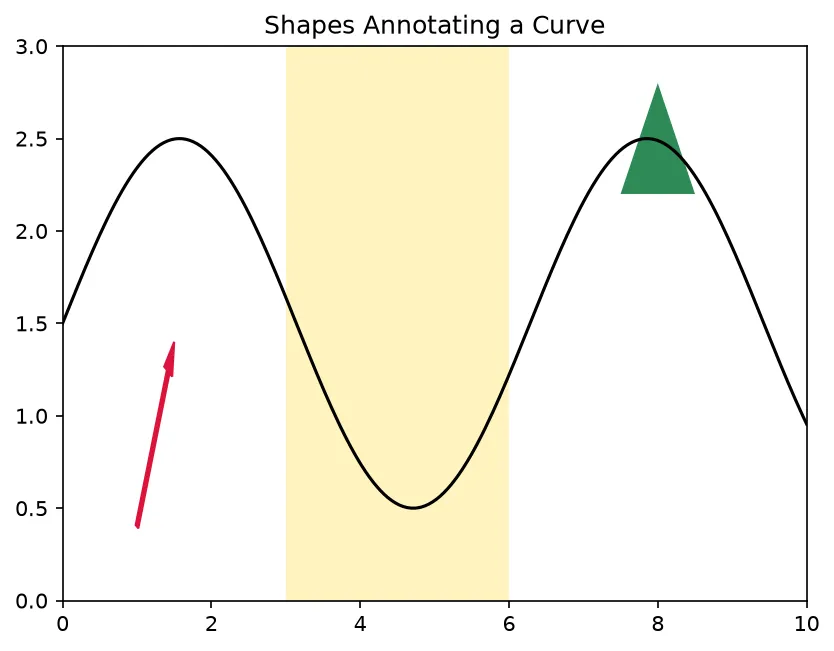
3 Many Shapes With a PatchCollection
Calling add_patch hundreds of times is slow. A PatchCollection bundles a list of shapes into one artist you add with ax.add_collection(), and you can color them all at once — even map a data array through a colormap.
import matplotlib.pyplot as plt
import numpy as np
from matplotlib.patches import Circle
from matplotlib.collections import PatchCollection

rng = np.random.default_rng(1)

# Build 40 circles at random spots with random sizes
circles = []
values = []
for _ in range(40):
    cx, cy = rng.uniform(0, 10, 2)
    r = rng.uniform(0.2, 0.8)
    circles.append(Circle((cx, cy), r))
    values.append(r)

# Color them all by radius through one collection
pc = PatchCollection(circles, cmap="viridis", alpha=0.8)
pc.set_array(np.array(values))

fig, ax = plt.subplots()
ax.add_collection(pc)
fig.colorbar(pc, ax=ax, label="radius")

ax.set_xlim(0, 10)
ax.set_ylim(0, 10)
ax.set_aspect("equal")
ax.set_title("A PatchCollection of Circles")

plt.show()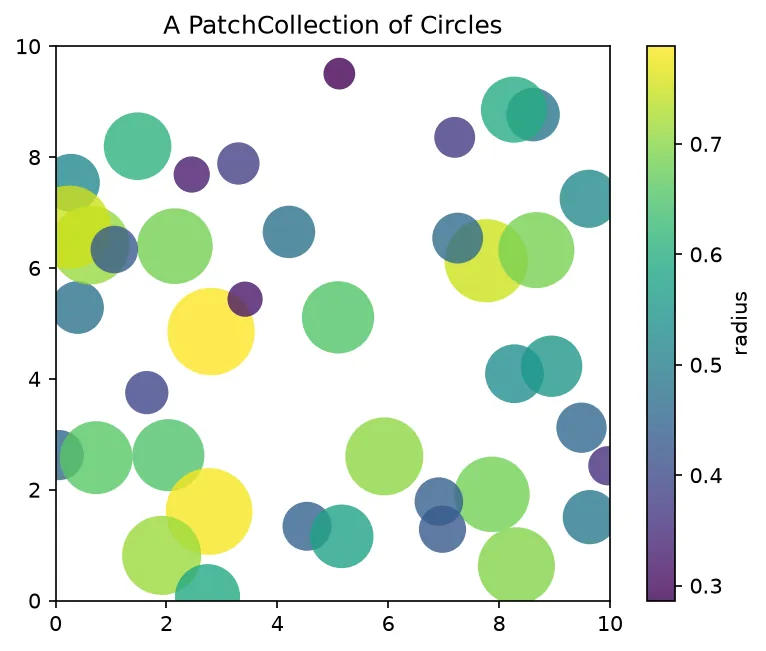
What you'll see: forty translucent circles scattered across the plot, each tinted along a viridis colormap by its radius, with a colorbar showing how size maps to color — all drawn in one efficient collection.
🎯 Your Turn: Fill in the Blanks
Replace each ___ to draw a green square on the axes.
import matplotlib.pyplot as plt
from matplotlib.patches import Rectangle

fig, ax = plt.subplots()

# A 2x2 square with its corner at (2, 2)
square = Rectangle((2, 2), 2, 2, facecolor="seagreen")

# Add the square to the axes
ax.___(square)

ax.set_xlim(0, 6)
ax.set_ylim(0, 6)
ax.set_aspect("___")   # so the square is not stretched
ax.set_title("A Green Square")

# Display the figure
plt.___()
📋 Common Errors & Quick Reference
❌ My shape does not appear
Patches do not expand the view. ✅ Set ax.set_xlim() / set_ylim() (or call ax.autoscale_view()) so the shape is inside the visible area.
❌ My circle looks like an oval
The axes have unequal unit sizes. ✅ Call ax.set_aspect('equal').
❌ TypeError: add_patch got a list
add_patch takes one patch. ✅ For many shapes, wrap them in PatchCollection and use ax.add_collection().
| Call | What It Does |
|---|---|
| Rectangle((x,y), w, h) | A rectangle from its corner |
| Circle((cx,cy), r) | A circle from center + radius |
| Polygon(points) | A shape from corner points |
| ax.add_patch(shape) | Places one shape |
| ax.add_collection(pc) | Places many shapes at once |
🎯 Mini-Challenge: A Simple Traffic Light
Use a Rectangle for the housing and three Circles for the lights to draw a traffic light.
import matplotlib.pyplot as plt
from matplotlib.patches import Rectangle, Circle

fig, ax = plt.subplots()

# The black housing
ax.add_patch(Rectangle((1, 0), 2, 5, facecolor="black"))

# Three lights, top to bottom
ax.add_patch(Circle((2, 4), 0.6, facecolor="red"))
ax.add_patch(Circle((2, 2.5), 0.6, facecolor="gold"))
ax.add_patch(Circle((2, 1), 0.6, facecolor="limegreen"))

ax.set_xlim(0, 4)
ax.set_ylim(-0.5, 5.5)
ax.set_aspect("equal")
ax.axis("off")
ax.set_title("Traffic Light from Patches")

plt.show()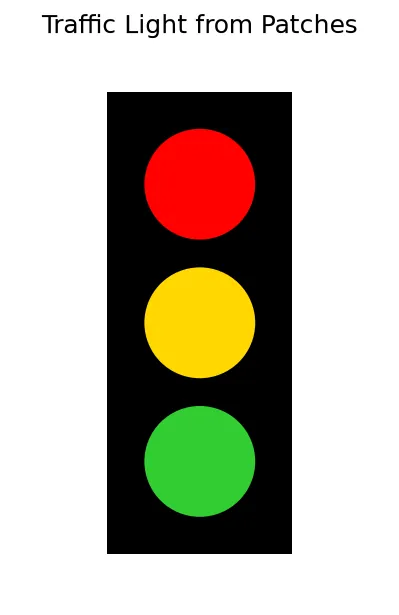
import matplotlib.pyplot as plt
from matplotlib.patches import Rectangle, Circle, Polygon

fig, ax = plt.subplots()
ax.set_xlim(0, 10)
ax.set_ylim(0, 10)

rect = Rectangle((1, 1), 3, 2, facecolor="steelblue", alpha=0.6)
circ = Circle((7, 7), 1.5, facecolor="tomato")
tri = Polygon([[5, 1], [7, 1], [6, 3]], facecolor="seagreen")
for p in (rect, circ, tri):
    ax.add_patch(p)

print("Patches added:", len(ax.patches))
print("Rectangle area:", rect.get_width() * rect.get_height())
print("Circle radius:", circ.radius)
print("Triangle corners:", [[int(x), int(y)] for x, y in tri.get_xy()[:3]])
print("Rectangle transparency:", rect.get_alpha())
print("All inside the axes:", rect.get_x() >= 0 and circ.center[0] + circ.radius <= 10)

# ✅ Expected output:
# Patches added: 3
# Rectangle area: 6
# Circle radius: 1.5
# Triangle corners: [[5, 1], [7, 1], [6, 3]]
# Rectangle transparency: 0.6
# All inside the axes: True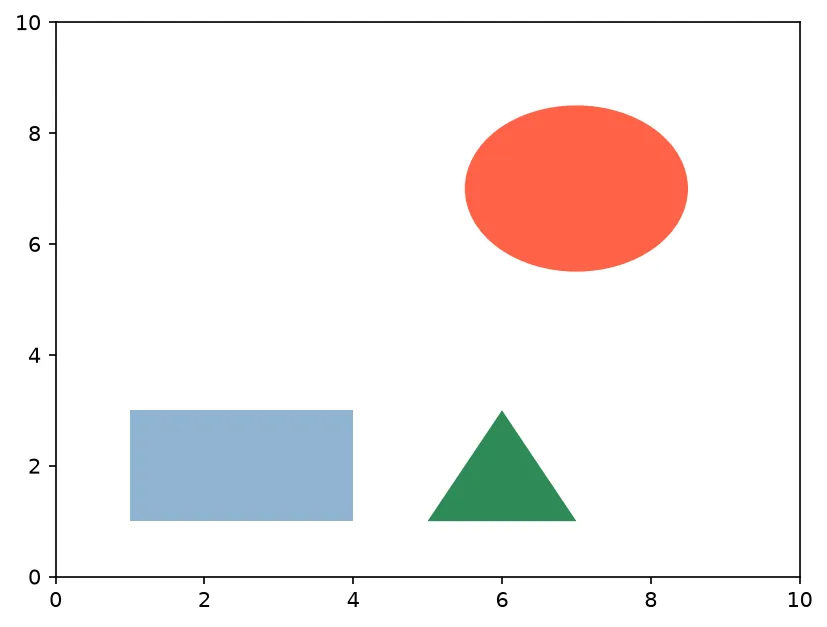
❓ Frequently Asked Questions
Lesson complete — you can draw on your plots!
You added rectangles, circles, polygons, and arrows, controlled fill and outline with facecolor, edgecolor, and alpha, shaded a region, and batched many shapes with a PatchCollection.
Practice quiz
What is a patch in Matplotlib?
- A bug fix
- A filled 2-D shape like Rectangle or Circle
- A type of colormap
- A legend entry
Answer: A filled 2-D shape like Rectangle or Circle. A patch is a filled geometric shape from matplotlib.patches, such as Rectangle or Circle.
Which call places a single shape onto an axes?
- ax.draw_shape()
- ax.patch()
- ax.shape()
- ax.add_patch()
Answer: ax.add_patch(). ax.add_patch(shape) adds one patch to the axes.
What arguments does Rectangle take?
- Its bottom-left corner plus a width and height
- Two opposite corners
- A center and radius
- Four separate corner points
Answer: Its bottom-left corner plus a width and height. Rectangle((x, y), width, height) is defined by its bottom-left corner, width, and height.
What arguments does Circle take?
- Three points on the circle
- A bounding box
- A center and a radius
- A start and end angle
Answer: A center and a radius. Circle((cx, cy), r) is defined by its center and radius.
Why might a shape not appear after add_patch?
- The color was wrong
- Patches do not auto-scale the view, so set the limits
- You must call it twice
- Patches need a legend
Answer: Patches do not auto-scale the view, so set the limits. Patches do not expand the view; set ax.set_xlim()/set_ylim() so the shape is visible.
Why does a Circle sometimes look like an oval?
- The radius is negative
- alpha is too low
- The figure is too small
- The axes have unequal unit sizes
Answer: The axes have unequal unit sizes. Different pixel sizes per data unit squash a circle; ax.set_aspect('equal') fixes it.
What does facecolor control?
- The interior fill of the shape
- The axis labels
- The outline only
- The shadow
Answer: The interior fill of the shape. facecolor fills the interior, while edgecolor draws the outline.
How do you make a shape hollow so only its outline shows?
- alpha=0
- Set fill=None and no edge
- facecolor='none'
- Remove the patch
Answer: facecolor='none'. facecolor='none' leaves the interior empty so only the edge shows.
How do you draw many shapes efficiently and color them together?
- Call add_patch in a loop only
- Use plt.scatter
- Plot each as a line
- Wrap them in a PatchCollection and add_collection()
Answer: Wrap them in a PatchCollection and add_collection(). A PatchCollection bundles many shapes into one artist added with ax.add_collection().
What does set_aspect('equal') ensure?
- The figure is square inches
- One data unit takes the same pixels on both axes
- The axes are logarithmic
- The patch is filled
Answer: One data unit takes the same pixels on both axes. set_aspect('equal') makes one data unit equal pixels on both axes, so circles look round.
Continue this course
- Previous: Inset & Broken Axes
- Next: Interactive Event Handling — Respond to clicks, key presses, and mouse motion on a figure
- Quick reference: Matplotlib cheat sheet
Frequently asked questions
What is a patch in Matplotlib?
A patch is a filled 2-D shape from the matplotlib.patches module — Rectangle, Circle, Ellipse, Polygon, FancyArrow, and more. Unlike plot() which connects data points, a patch is a standalone geometric object you place at chosen coordinates and add to an axes with ax.add_patch().
Why does my Circle look like an oval?
The data units on the x and y axes have different pixel sizes, so a circle in data space is squashed. Fix it with ax.set_aspect('equal'), which forces one data unit to take the same number of pixels on both axes, making circles truly round.
What is the difference between facecolor and edgecolor?
facecolor fills the interior of the shape, while edgecolor draws its outline. Set them independently: facecolor='skyblue', edgecolor='navy'. You can also make a shape hollow with facecolor='none' so only the outline shows, or translucent with alpha to let plotted data show through.
When should I use a PatchCollection instead of many add_patch calls?
When you have many shapes, a PatchCollection draws them far more efficiently and lets you set or color them all at once. Build a list of patches, wrap it in PatchCollection(patches), optionally pass an array to color them by value, then add it with ax.add_collection().