Inset & Broken Axes
Reviewed & published by Brayan K
An inset axes is a small zoomed-in plot drawn inside a larger one, and a broken axis cuts a gap out of a scale so distant data clusters can share a single chart without wasting empty space.
Part of the free Matplotlib course at LearnCodingFast — hands-on lessons with worked examples and the output they print, plus practice exercises and a quick quiz.
In this lesson you'll add a zoom-in with ax.inset_axes(), mark the zoomed region with indicate_inset_zoom(), and hand-build a broken axis from two subplots with diagonal break marks.
What You'll Learn in This Lesson
- Creating an inset with ax.inset_axes()
- Setting the inset's xlim/ylim to a zoom region
- Marking the region with indicate_inset_zoom()
- Stacking two subplots that share an x-axis
- Hiding the facing spines to form a break
- Drawing diagonal break marks across the gap
1 A Zoom-In Inset
ax.inset_axes([x, y, w, h]) drops a miniature Axes inside the main one. The four numbers are in axes-fraction coordinates: position the bottom-left corner at (x, y) and give it width w and height h. Plot the same data on the inset, then narrow its limits to the region you want to magnify.
import matplotlib.pyplot as plt
import numpy as np

x = np.linspace(0, 5, 500)
y = np.sin(x) * np.exp(-x / 5)

fig, ax = plt.subplots()
ax.plot(x, y, color="darkblue")
ax.set_title("Damped Sine with a Zoom Inset")

# A small inset in the upper-right corner
axins = ax.inset_axes([0.55, 0.55, 0.4, 0.4])
axins.plot(x, y, color="darkblue")

# Zoom into the first peak
axins.set_xlim(1.0, 2.2)
axins.set_ylim(0.4, 0.85)
axins.set_title("zoom", fontsize=9)

plt.show()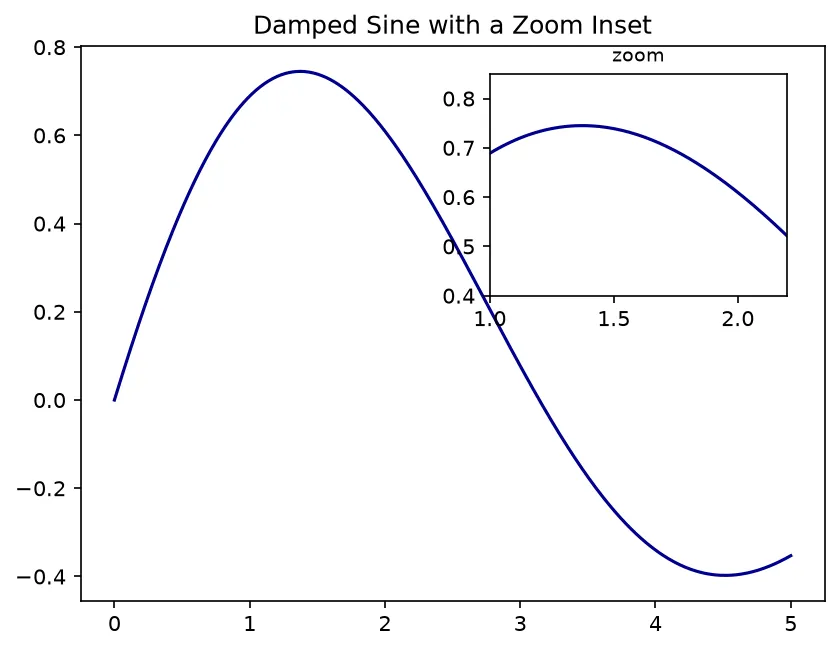
What you'll see: a damped sine curve filling the plot with a small framed copy in the upper-right that magnifies just the first peak, revealing detail that is hard to read in the full view.
2 Linking the Inset With indicate_inset_zoom
A floating zoom is clearer when the reader can see where it came from. After setting the inset's limits, call ax.indicate_inset_zoom(axins). Matplotlib draws a rectangle on the main axes around the zoom region and connector lines to the inset.
import matplotlib.pyplot as plt
import numpy as np

rng = np.random.default_rng(0)
x = np.linspace(0, 10, 1000)
y = np.sin(x) + rng.normal(0, 0.08, x.size)

fig, ax = plt.subplots()
ax.plot(x, y, color="seagreen", linewidth=0.8)
ax.set_title("Noisy Signal with Linked Zoom")

axins = ax.inset_axes([0.6, 0.08, 0.36, 0.36])
axins.plot(x, y, color="seagreen", linewidth=0.8)
axins.set_xlim(4.0, 4.8)
axins.set_ylim(-0.5, 0.5)
axins.set_xticklabels([])
axins.set_yticklabels([])

# Draw the indicator rectangle + connector lines
ax.indicate_inset_zoom(axins, edgecolor="black")

plt.show()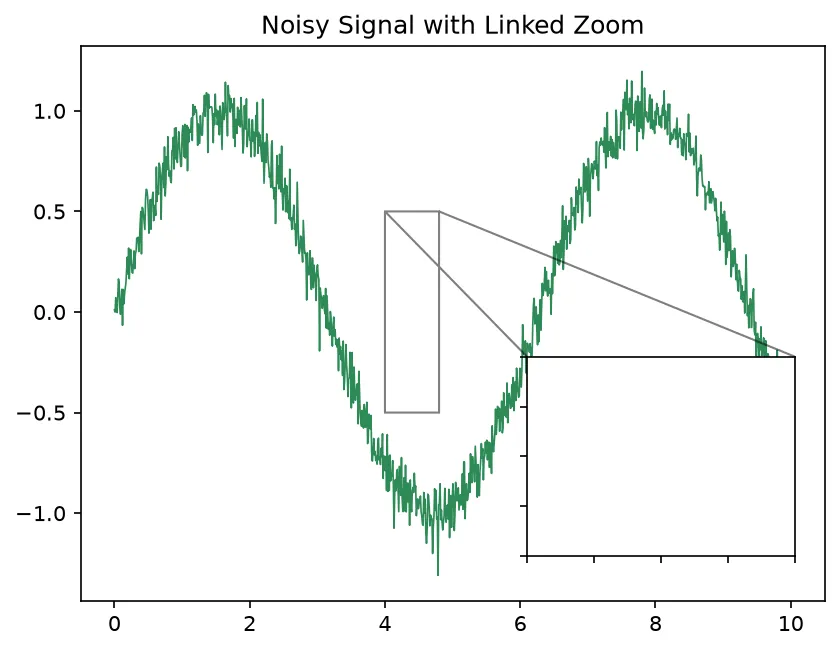
3 A Broken Axis From Two Subplots
Matplotlib has no one-line broken axis, but the recipe is reliable: stack two subplots that share the x-axis, give the top one the high range and the bottom one the low range, hide the facing spines, and draw small diagonal marks where the break sits.
import matplotlib.pyplot as plt
import numpy as np

cats = ["A", "B", "C", "D", "E"]
vals = [9, 11, 8, 980, 1000]   # two values are huge

fig, (ax_top, ax_bot) = plt.subplots(
    2, 1, sharex=True,
    gridspec_kw={"height_ratios": [1, 1], "hspace": 0.08})

ax_top.bar(cats, vals, color="indigo")
ax_bot.bar(cats, vals, color="indigo")

# Top shows the high cluster, bottom shows the low one
ax_top.set_ylim(950, 1050)
ax_bot.set_ylim(0, 15)

# Hide the facing spines to open the gap
ax_top.spines["bottom"].set_visible(False)
ax_bot.spines["top"].set_visible(False)
ax_top.tick_params(bottom=False)

# Diagonal break marks
d = 0.5
kw = dict(marker=[(-1, -d), (1, d)], markersize=12,
          linestyle="none", color="k", mec="k", mew=1, clip_on=False)
ax_top.plot([0, 1], [0, 0], transform=ax_top.transAxes, **kw)
ax_bot.plot([0, 1], [1, 1], transform=ax_bot.transAxes, **kw)

fig.suptitle("Broken Y-Axis")

plt.show()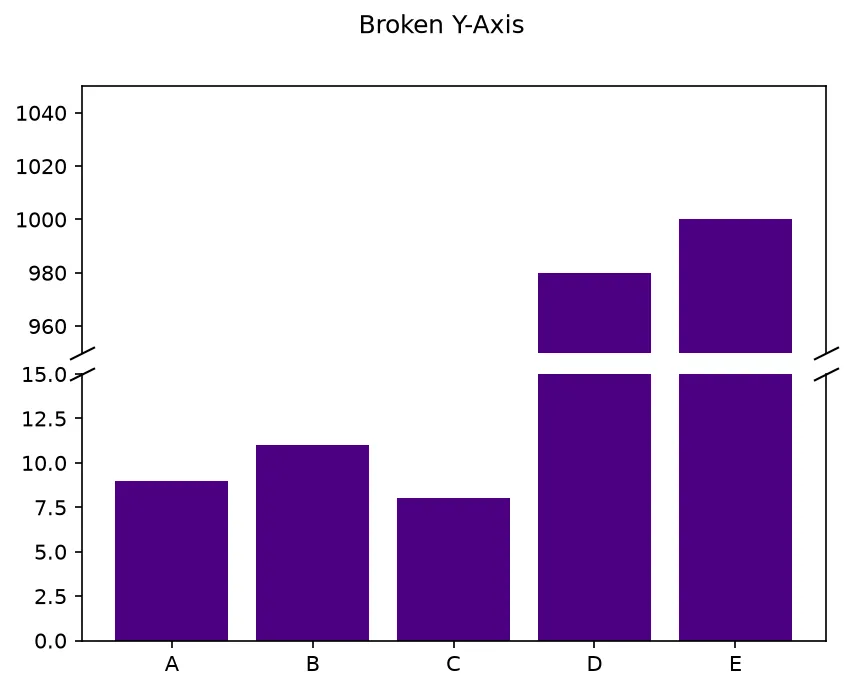
What you'll see: two short bars and two towering bars sharing one chart — the y-axis has a visible gap with little diagonal slashes, so the huge values and the tiny values are both readable without one dwarfing the other.
🎯 Your Turn: Fill in the Blanks
Replace each ___ to add an inset and zoom it into the data's first second.
import matplotlib.pyplot as plt
import numpy as np

t = np.linspace(0, 10, 500)
v = np.cos(2 * t)

fig, ax = plt.subplots()
ax.plot(t, v, color="darkred")

# Create an inset in the lower-left: [x, y, w, h]
axins = ax.___([0.08, 0.1, 0.35, 0.35])
axins.plot(t, v, color="darkred")

# Zoom the inset to t between 0 and 1
axins.set_xlim(0, ___)
axins.set_ylim(-1, 1)

ax.set_title("Inset Practice")

# Display the figure
plt.___()
📋 Common Errors & Quick Reference
❌ The inset is empty
You created the inset but plotted only on the main axes. ✅ Call axins.plot(...) on the inset too, then set its limits.
❌ indicate_inset_zoom draws nothing useful
You called it before narrowing the inset. ✅ Set axins.set_xlim/ylim first so it knows the region.
❌ Break marks vanish at the figure edge
They are clipped to the axes. ✅ Pass clip_on=False and draw them in transAxes coordinates.
| Call | What It Does |
|---|---|
| ax.inset_axes([x,y,w,h]) | Adds a small inset axes |
| axins.set_xlim / set_ylim | Sets the zoom window |
| ax.indicate_inset_zoom(axins) | Draws the linking rectangle |
| sharex=True | Links subplot x-axes for a break |
| spine.set_visible(False) | Opens the gap in a broken axis |
🎯 Mini-Challenge: Zoom Into a Spike
Plot a curve with a sharp spike, add an inset zoomed onto the spike, and link it with indicate_inset_zoom.
import matplotlib.pyplot as plt
import numpy as np

x = np.linspace(0, 10, 1000)
y = np.exp(-((x - 5) ** 2) / 0.05)   # a tall narrow spike at x=5

fig, ax = plt.subplots()
ax.plot(x, y, color="darkorange")
ax.set_title("Spike with Linked Zoom")

axins = ax.inset_axes([0.08, 0.5, 0.35, 0.4])
axins.plot(x, y, color="darkorange")
axins.set_xlim(4.7, 5.3)
axins.set_ylim(0, 1.05)

ax.indicate_inset_zoom(axins, edgecolor="gray")

plt.show()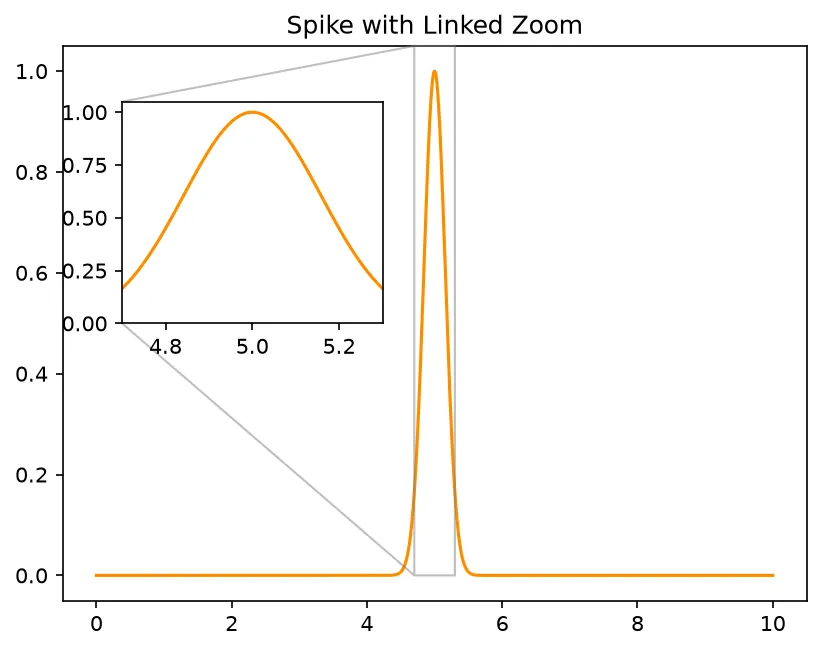
import matplotlib.pyplot as plt

x = list(range(20))
y = [v * v for v in x]

fig, ax = plt.subplots()
ax.plot(x, y)

inset = ax.inset_axes([0.55, 0.1, 0.4, 0.4])
inset.plot(x[:5], y[:5])
inset.set_xlim(0, 4)
inset.set_ylim(0, 16)
ax.indicate_inset_zoom(inset)

print("Inset axes attached to the main one:", len(ax.child_axes))
print("Inset x range:", [float(v) for v in inset.get_xlim()])
print("Inset y range:", [float(v) for v in inset.get_ylim()])
print("Main axes reaches:", max(y))
print("The inset shows only the start:", inset.get_xlim()[1] < max(x))
print("Inset sits inside the main axes:", inset.get_position().x0 > ax.get_position().x0)

# ✅ Expected output:
# Inset axes attached to the main one: 1
# Inset x range: [0.0, 4.0]
# Inset y range: [0.0, 16.0]
# Main axes reaches: 361
# The inset shows only the start: True
# Inset sits inside the main axes: True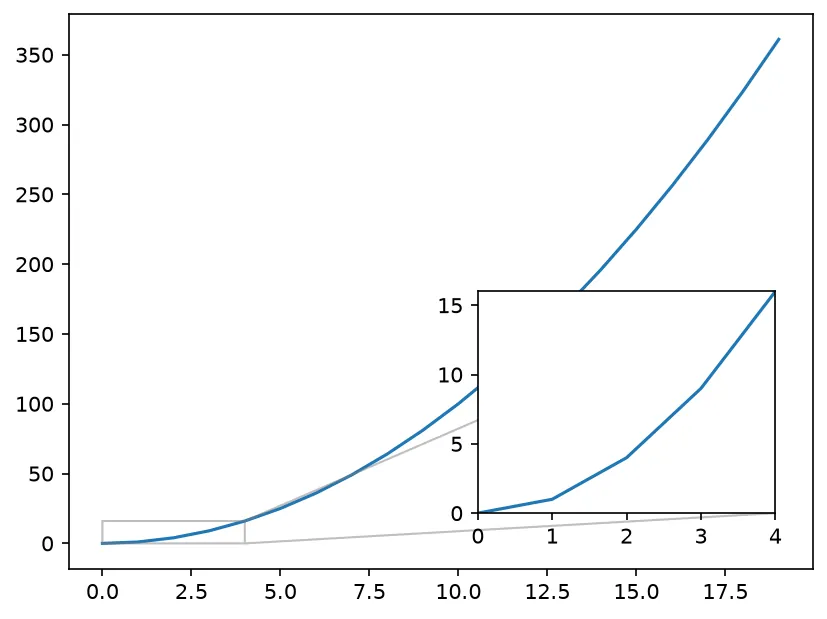
❓ Frequently Asked Questions
Lesson complete — you can zoom and break axes!
You added a zoom-in inset, linked it to its region with indicate_inset_zoom, and hand-built a broken axis from two subplots with diagonal break marks.
Practice quiz
What does ax.inset_axes([x, y, w, h]) create?
- A new figure window
- A small inset axes inside the main axes
- A colorbar
- A second x-axis
Answer: A small inset axes inside the main axes. inset_axes drops a miniature Axes inside the parent axes.
In what coordinate system are the four inset_axes numbers given?
- Pixels
- Data units
- Inches
- Axes-fraction coordinates
Answer: Axes-fraction coordinates. [x, y, w, h] are in axes-fraction coordinates of the parent axes.
How do you restrict an inset to a zoom region?
- Set its xlim and ylim
- Call inset.zoom()
- Pass zoom=True
- Use plt.magnify()
Answer: Set its xlim and ylim. You narrow the inset with axins.set_xlim() and set_ylim() to the region of interest.
What does ax.indicate_inset_zoom(axins) draw?
- A colorbar
- A second legend
- A rectangle and connector lines linking the region to the inset
- A title
Answer: A rectangle and connector lines linking the region to the inset. It marks the zoom region with a rectangle and connectors to the inset.
When must you set the inset's limits relative to indicate_inset_zoom?
- After it
- Before it, so it knows the region
- It does not matter
- Only inside a loop
Answer: Before it, so it knows the region. indicate_inset_zoom reads the inset's xlim/ylim, so set them first.
Does Matplotlib have a single built-in broken-axis function?
- Yes, plt.brokenaxis()
- Yes, ax.break_axis()
- Yes, plt.gap()
- No, you build it from two subplots
Answer: No, you build it from two subplots. There is no one-liner; the recipe uses two subplots sharing an axis.
Which argument links two subplots to share their x-axis for a break?
- sharex=True
- linkx=True
- joinx=True
- samex=True
Answer: sharex=True. plt.subplots(2, 1, sharex=True) links the x-axes of the stacked panels.
How do you open the visual gap between the two broken-axis panels?
- Increase the DPI
- Use a log scale
- Hide the facing spines with spine.set_visible(False)
- Call ax.gap()
Answer: Hide the facing spines with spine.set_visible(False). Hiding the bottom spine of the top panel and the top spine of the bottom panel opens the break.
Why pass clip_on=False when drawing the diagonal break marks?
- To color them red
- So they are not clipped at the axes edge
- To make them dashed
- To rotate them
Answer: So they are not clipped at the axes edge. The marks sit at the axes boundary, so clip_on=False keeps them from being clipped.
When is a broken axis preferable to a log scale?
- When values span many orders of magnitude smoothly
- When all values are negative
- When you want a circular plot
- When two clusters are separated by a large empty gap
Answer: When two clusters are separated by a large empty gap. A broken axis compresses an empty gap between two clusters without distorting spacing within them.
Continue this course
- Previous: Advanced Legends
- Next: Drawing Shapes (Patches) — Add rectangles, circles, and polygons to highlight regions
- Quick reference: Matplotlib cheat sheet › Labels & Legends
Frequently asked questions
What is an inset axes and when should I use one?
An inset axes is a small second plot drawn inside the main one, created with ax.inset_axes([x, y, w, h]). The four numbers are in axes-fraction coordinates. Use an inset to zoom into a crowded region while still showing the full picture, so readers see both the overview and the detail in a single figure.
How does indicate_inset_zoom show which region is zoomed?
After you set the inset's xlim and ylim to the zoom region, call ax.indicate_inset_zoom(axins). Matplotlib draws a rectangle on the main axes around that region and connector lines linking it to the inset, so the reader instantly sees where the close-up came from.
Does Matplotlib have a built-in broken axis?
There is no single broken-axis function. The standard recipe is two stacked (or side-by-side) subplots that share an axis, each showing a different range, with the facing spines hidden and small diagonal tick marks drawn to signal the break. It looks like one axis with a gap cut out.
Why use a broken axis instead of a log scale?
A broken axis is best when your data has two clusters separated by a large empty gap — for example most values near 10 and one near 1000. It compresses the empty middle without distorting the spacing within each cluster, which a log scale would. Use a log scale when values span many orders of magnitude smoothly.