Advanced Legends
Reviewed & published by Brayan K
A legend is the key that maps each color, line, or marker to what it represents, and Matplotlib lets you place it anywhere, split it into columns, give it custom entries, and even show several at once.
Part of the free Matplotlib course at LearnCodingFast — hands-on lessons with worked examples and the output they print, plus practice exercises and a quick quiz.
In this lesson you'll move legends outside the axes with bbox_to_anchor, lay them out in columns, build custom handles with Line2D and Patch, and stack two legends on one chart.
What You'll Learn in This Lesson
- Positioning a legend with loc
- Placing it outside the axes with bbox_to_anchor
- Splitting entries across columns with ncol
- Adding a legend title
- Building custom handles with Line2D and Patch
- Showing two legends with add_artist()
1 Placing a Legend Outside the Axes
When lines crowd the corners, push the legend outside the plot. The trick is to pair loc with bbox_to_anchor, a point in axes-fraction coordinates where (0, 0) is the bottom-left and (1, 1) is the top-right. loc names which corner of the legend box latches onto that point.
import matplotlib.pyplot as plt
import numpy as np

x = np.linspace(0, 10, 100)

fig, ax = plt.subplots()
ax.plot(x, np.sin(x), label="sin")
ax.plot(x, np.cos(x), label="cos")
ax.plot(x, np.sin(x) * 0.5, label="half sin")

# Park the legend just outside, to the right
ax.legend(loc="center left", bbox_to_anchor=(1.02, 0.5),
          title="Curves")

ax.set_title("Legend Outside the Axes")
fig.tight_layout()

plt.show()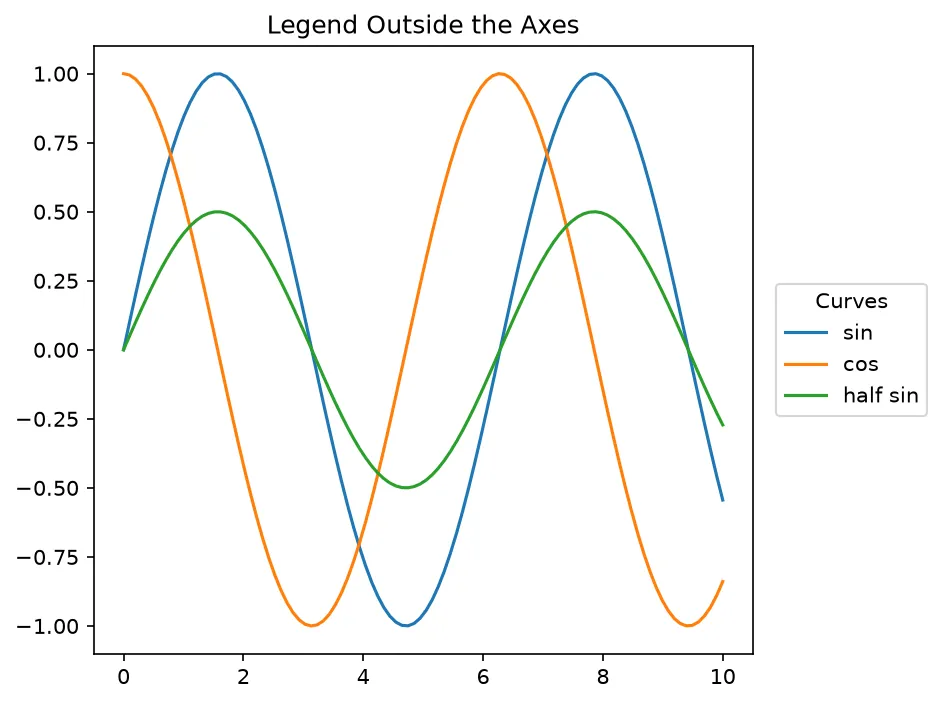
What you'll see: three trig curves filling the full plotting area, with a titled legend box sitting neatly to the right of the axes instead of covering any of the lines.
2 Columns & Custom Handles
Use ncol to lay entries out horizontally — perfect for a legend placed above a wide chart. You can also invent entries that match nothing on the plot using proxy artists: build a Line2D or a Patch by hand and pass them as handles.
import matplotlib.pyplot as plt
import numpy as np
from matplotlib.lines import Line2D
from matplotlib.patches import Patch

x = np.linspace(0, 10, 100)

fig, ax = plt.subplots()
ax.fill_between(x, np.sin(x) - 0.3, np.sin(x) + 0.3,
                color="skyblue", alpha=0.5)
ax.plot(x, np.sin(x), color="navy")

# Build legend entries by hand
handles = [
    Line2D([], [], color="navy", label="Signal"),
    Patch(facecolor="skyblue", alpha=0.5, label="Confidence band"),
    Line2D([], [], color="red", marker="o", linestyle="None",
           label="Anomaly"),
]

# Lay them out in 3 columns above the plot
ax.legend(handles=handles, ncol=3,
          loc="lower center", bbox_to_anchor=(0.5, 1.02))

ax.set_title("Custom Handles in Columns")
fig.tight_layout()

plt.show()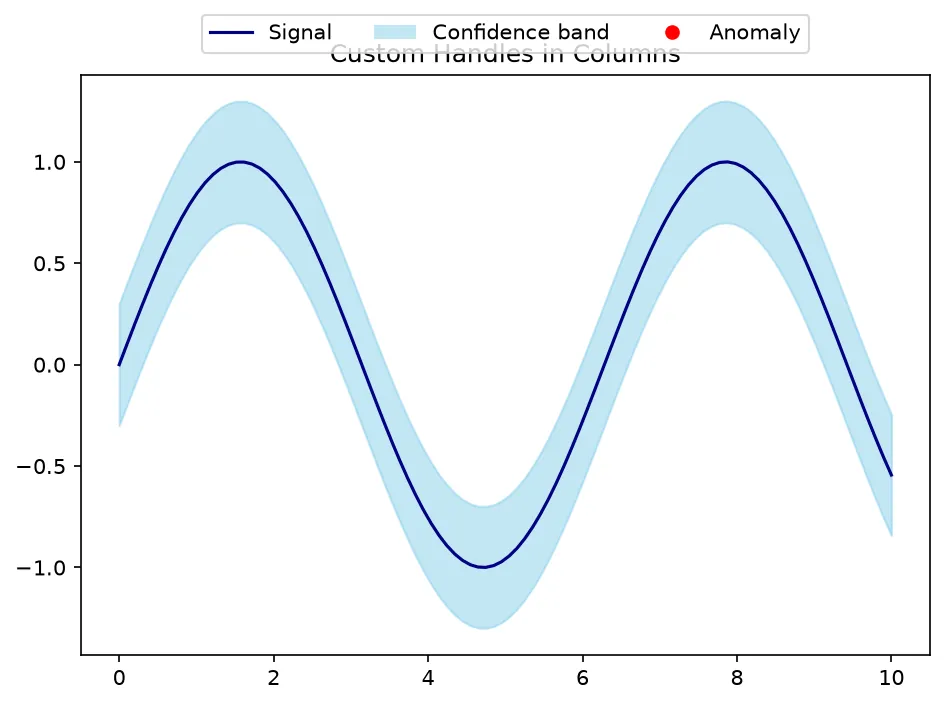
3 Two Legends on One Chart
Calling ax.legend() a second time replaces the first. To keep both, capture the first legend in a variable and re-attach it with ax.add_artist() before creating the second. This lets you group entries — say, one legend for line styles and another for colors.
import matplotlib.pyplot as plt
import numpy as np

x = np.linspace(0, 10, 100)

fig, ax = plt.subplots()
l1, = ax.plot(x, np.sin(x), color="crimson", label="Series A")
l2, = ax.plot(x, np.cos(x), color="teal", label="Series B")
l3, = ax.plot(x, np.sin(x) * 0.5, "--", color="gray", label="Dashed")

# First legend: just the two solid series
first = ax.legend(handles=[l1, l2], loc="upper right",
                  title="Data")

# Re-add it so the next legend does not erase it
ax.add_artist(first)

# Second legend: the line-style note, lower left
ax.legend(handles=[l3], loc="lower left", title="Style")

ax.set_title("Two Legends at Once")

plt.show()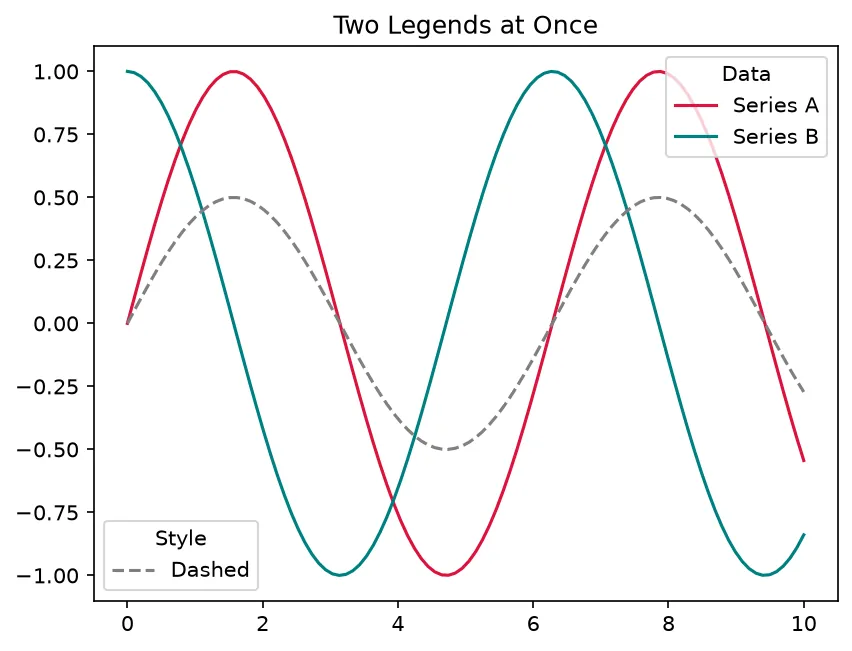
What you'll see: a "Data" legend in the upper-right naming the two solid series and a separate "Style" legend in the lower-left explaining the dashed line — both visible because add_artist preserved the first.
🎯 Your Turn: Fill in the Blanks
Replace each ___ to push the legend below the chart in two columns.
import matplotlib.pyplot as plt
import numpy as np

x = np.linspace(0, 6, 100)

fig, ax = plt.subplots()
ax.plot(x, x, label="linear")
ax.plot(x, x**2 / 6, label="quadratic")

# Put the legend below the axes, in 2 columns
ax.legend(loc="upper center",
          bbox_to_anchor=(0.5, -0.12),
          ncol=___)

ax.set_title("Below-Axes Legend")
fig.tight_layout()

# Display the figure
plt.___()
📋 Common Errors & Quick Reference
❌ The outside legend is cut off when I save
The default bounding box ignores artists outside the axes. ✅ Save with bbox_inches='tight' or call fig.tight_layout() first.
❌ My second legend made the first disappear
A new ax.legend() replaces the old one. ✅ Save the first in a variable and call ax.add_artist(first) before the second legend.
❌ Empty legend / "No artists with labels found"
Nothing has a label. ✅ Pass label= when plotting, or supply handles= explicitly.
| Call | What It Does |
|---|---|
| loc='upper right' | Anchors the legend corner |
| bbox_to_anchor=(1, 0.5) | Positions the legend in axes fractions |
| ncol=3 | Splits entries into columns |
| handles=[...] | Supplies custom proxy entries |
| ax.add_artist(legend) | Keeps an earlier legend visible |
🎯 Mini-Challenge: A Categorized Legend
Build a legend from three custom Patch handles representing risk levels, placed outside the axes with a title.
import matplotlib.pyplot as plt
import numpy as np
from matplotlib.patches import Patch

x = np.arange(8)
y = np.array([2, 5, 9, 4, 7, 1, 6, 3])

# Color each bar by a risk threshold
colors = ["green" if v < 4 else "orange" if v < 7 else "red"
          for v in y]

fig, ax = plt.subplots()
ax.bar(x, y, color=colors)

# A custom legend explaining the colors
handles = [
    Patch(facecolor="green", label="Low (<4)"),
    Patch(facecolor="orange", label="Medium (4-6)"),
    Patch(facecolor="red", label="High (7+)"),
]
ax.legend(handles=handles, title="Risk level",
          loc="center left", bbox_to_anchor=(1.02, 0.5))

ax.set_title("Risk by Category")
fig.tight_layout()

plt.show()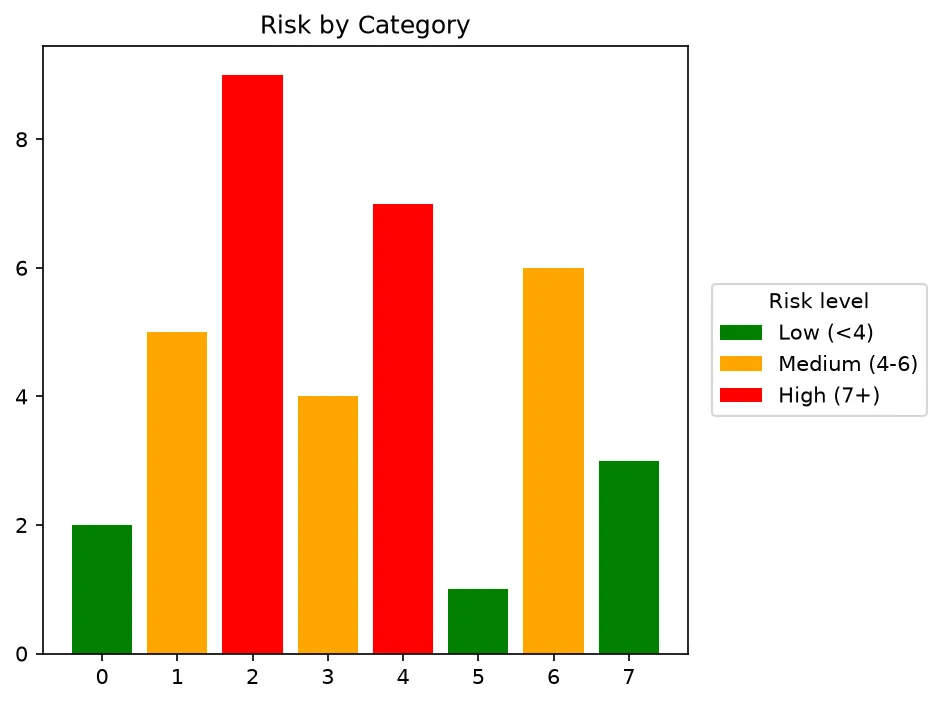
import matplotlib.pyplot as plt
from matplotlib.lines import Line2D

fig, ax = plt.subplots()
ax.plot([1, 2, 3], [1, 2, 3], label="rising")
ax.plot([1, 2, 3], [3, 2, 1], label="falling")
ax.plot([1, 2, 3], [2, 2, 2], label="_hidden")

custom = [Line2D([0], [0], color="black", linestyle=":", label="target")]
handles, labels = ax.get_legend_handles_labels()
leg = ax.legend(handles + custom, labels + ["target"], ncols=2, title="series", loc="lower left")

print("Lines drawn:", len(ax.lines))
print("Automatic labels:", labels)
print("A leading underscore hides a line from the legend:", "_hidden" not in labels)
print("Legend entries:", [t.get_text() for t in leg.get_texts()])
print("The custom handle kept its style:", leg.legend_handles[-1].get_linestyle())
print("Handles in the legend:", len(leg.legend_handles))
print("Title:", leg.get_title().get_text())

# ✅ Expected output:
# Lines drawn: 3
# Automatic labels: ['rising', 'falling']
# A leading underscore hides a line from the legend: True
# Legend entries: ['rising', 'falling', 'target']
# The custom handle kept its style: :
# Handles in the legend: 3
# Title: series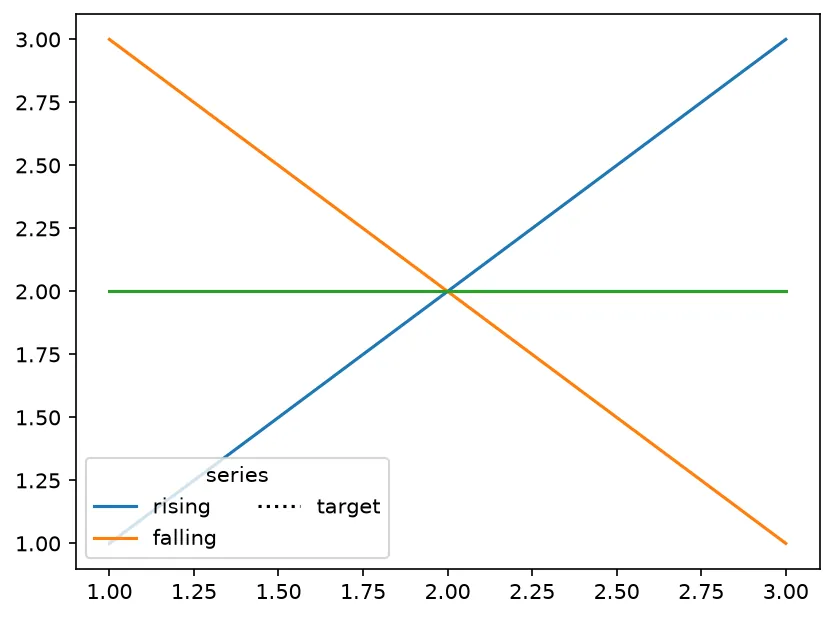
❓ Frequently Asked Questions
Lesson complete — your legends are pro-grade!
You positioned legends outside the axes, split entries into columns, built custom handles with Line2D and Patch, and stacked two legends using add_artist.
Practice quiz
Which argument positions a legend outside the axes by a reference point?
- outside=True
- bbox_to_anchor
- offset
- anchor_box
Answer: bbox_to_anchor. bbox_to_anchor gives a reference point in axes-fraction coordinates for placing the legend.
In ax.legend(loc='center left', bbox_to_anchor=(1, 0.5)), what does loc do?
- Sets the axes scale
- Hides part of the legend
- Names a color
- Picks which corner of the legend box anchors to the point
Answer: Picks which corner of the legend box anchors to the point. loc selects the legend-box corner that latches onto the bbox_to_anchor point.
Which argument lays legend entries out in multiple columns?
- ncol
- columns
- rows
- split
Answer: ncol. ncol=3 arranges the entries into three columns.
What is a proxy artist (custom handle) used for?
- To save the figure faster
- To clear the axes
- A legend entry that does not match any plotted line
- To rotate the legend
Answer: A legend entry that does not match any plotted line. Proxy artists like Line2D or Patch create legend entries without drawing on the axes.
Which import gives you a line-style proxy handle?
- from matplotlib.axes import Line2D
- from matplotlib import Line2D
- from matplotlib.pyplot import Line2D
- from matplotlib.lines import Line2D
Answer: from matplotlib.lines import Line2D. Line2D lives in matplotlib.lines.
Which import gives you a filled-swatch proxy handle?
- from matplotlib.lines import Patch
- from matplotlib.patches import Patch
- from matplotlib import Patch
- from matplotlib.legend import Patch
Answer: from matplotlib.patches import Patch. Patch comes from matplotlib.patches and shows a colored swatch.
What happens when you call ax.legend() a second time?
- It replaces the first legend
- It merges both into one
- It raises an error
- It is ignored
Answer: It replaces the first legend. A second ax.legend() call replaces the first legend by default.
How do you keep both legends visible on one axes?
- Pass keep=True
- Call legend twice quickly
- Capture the first and re-add it with ax.add_artist(first)
- Use two figures
Answer: Capture the first and re-add it with ax.add_artist(first). Save the first legend and call ax.add_artist(first) before creating the second.
What does a proxy Line2D([], []) require for its data?
- A full dataset
- At least three points
- Random data
- Empty data, since it only shows a sample
Answer: Empty data, since it only shows a sample. A proxy Line2D needs empty data ([], []) because it only appears in the legend.
When saving a figure with an outside legend, what prevents it being cut off?
- bbox_inches='tight'
- dpi=50
- transparent=True
- format='svg'
Answer: bbox_inches='tight'. savefig(..., bbox_inches='tight') expands the bounding box to include the outside legend.
Continue this course
- Previous: Customizing Spines & Axis Position
- Next: Inset & Broken Axes — Add zoom-in insets and broken-axis effects
- Quick reference: Matplotlib cheat sheet
Frequently asked questions
How do I move the legend outside the plot area?
Combine loc with bbox_to_anchor. For a legend to the right of the axes use ax.legend(loc='center left', bbox_to_anchor=(1, 0.5)). The bbox_to_anchor gives a point in axes-fraction coordinates, and loc says which corner of the legend box anchors to that point. Add bbox_inches='tight' when saving so the legend is not clipped.
How do I make a legend span multiple columns?
Pass the ncol argument: ax.legend(ncol=3) lays the entries out in three columns instead of one tall stack. This is ideal for a wide figure or a legend placed above the axes where horizontal space is plentiful.
How do I build a legend entry that does not match any plotted line?
Create proxy artists. Import Line2D from matplotlib.lines or Patch from matplotlib.patches, build the handles you want (for example Line2D([], [], color='red', label='Threshold')), and pass them as handles to ax.legend(handles=[...]). The proxies appear in the legend without drawing anything on the axes.
Can a single figure have two separate legends?
Yes. A second call to ax.legend() replaces the first, so capture the first legend in a variable, then re-add it with ax.add_artist(first) before creating the second legend. That keeps both on the axes at once.