Customizing Spines & Axis Position
Reviewed & published by Brayan K
Spines are the four border lines around a plot, and customizing them lets you hide clutter, recolor edges, or move the axes to cross at the origin for a clean, professional look.
Part of the free Matplotlib course at LearnCodingFast — hands-on lessons with worked examples and the output they print, plus practice exercises and a quick quiz.
In this lesson you'll hide the top and right borders, recolor and thicken spines, shorten them with bounds, and move the left and bottom spines to zero for a centered, math-style axis.
What You'll Learn in This Lesson
- Accessing the four spines via ax.spines
- Hiding the top and right spines for a minimalist chart
- Recoloring and thickening spines
- Shortening a spine with set_bounds()
- Moving spines to zero to center the axes
- Keeping ticks aligned with moved spines
1 Hiding the Top & Right Spines
Every Axes has four spines stored in ax.spines: 'top', 'bottom', 'left', and 'right'. The single most popular tweak in all of Matplotlib is hiding the top and right ones — it removes the box and instantly modernizes the chart.
import matplotlib.pyplot as plt
import numpy as np

x = np.linspace(0, 10, 100)
y = np.sin(x)

fig, ax = plt.subplots()
ax.plot(x, y, color="crimson")

# Remove the boxy top and right borders
ax.spines["top"].set_visible(False)
ax.spines["right"].set_visible(False)

ax.set_title("Minimalist Sine Wave")
ax.set_xlabel("x")
ax.set_ylabel("sin(x)")

plt.show()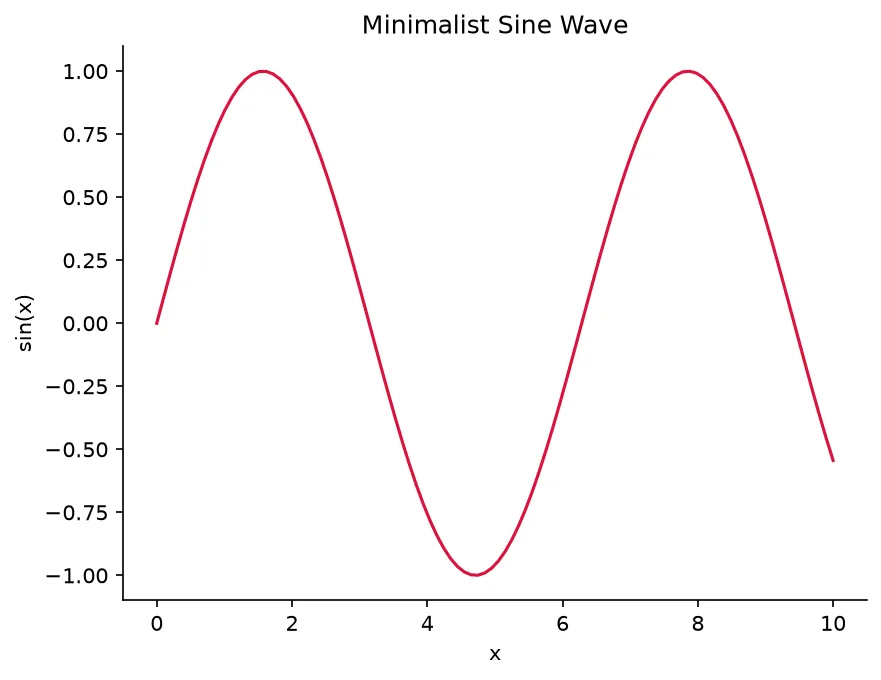
What you'll see: a crimson sine wave with only an L-shaped frame — the left and bottom spines remain, but the top and right borders are gone, so the chart feels open and uncluttered.
2 Recoloring, Thickening & Shortening Spines
A spine is a full artist, so you can restyle it. Use set_color() and set_linewidth() to change how it looks, and set_bounds(low, high) to draw it only across part of the axis — handy for emphasizing the range your data actually covers.
import matplotlib.pyplot as plt
import numpy as np

x = np.arange(0, 10)
y = x ** 1.5

fig, ax = plt.subplots()
ax.plot(x, y, marker="o", color="teal")

# Hide the clutter
ax.spines["top"].set_visible(False)
ax.spines["right"].set_visible(False)

# Restyle what remains
ax.spines["left"].set_color("darkorange")
ax.spines["left"].set_linewidth(3)
ax.spines["bottom"].set_linewidth(3)

# Shorten the bottom spine to the data range
ax.spines["bottom"].set_bounds(0, 9)

ax.set_title("Styled Spines")

plt.show()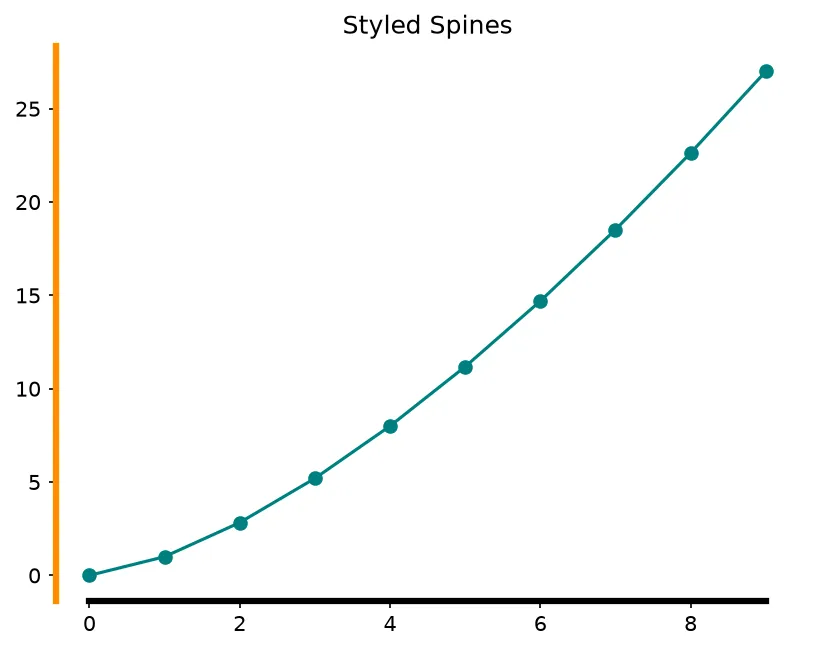
3 Centering the Axes at Zero
To get the classic math-textbook cross through the origin, move the left and bottom spines to the data value 0 with set_position('zero'), then hide the top and right spines. Finally, tell the ticks to follow by calling ax.xaxis.set_ticks_position('bottom') and ax.yaxis.set_ticks_position('left').
import matplotlib.pyplot as plt
import numpy as np

x = np.linspace(-5, 5, 200)
y = x ** 3 - 4 * x

fig, ax = plt.subplots()
ax.plot(x, y, color="purple")

# Move the left and bottom spines to cross at (0, 0)
ax.spines["left"].set_position("zero")
ax.spines["bottom"].set_position("zero")

# Drop the other two
ax.spines["top"].set_visible(False)
ax.spines["right"].set_visible(False)

# Keep ticks on the moved spines
ax.xaxis.set_ticks_position("bottom")
ax.yaxis.set_ticks_position("left")

ax.set_title("Axes Centered at the Origin")

plt.show()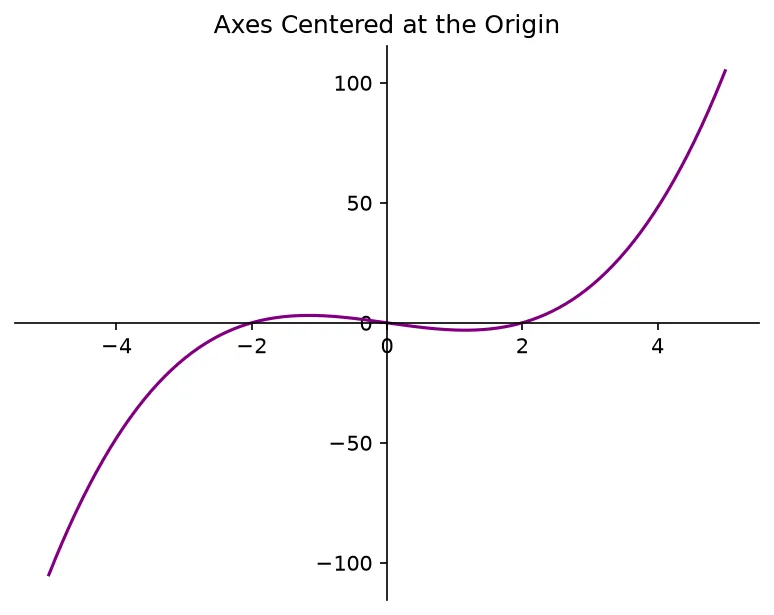
What you'll see: the purple cubic curve passing through a cross formed by the x and y axes meeting at the center of the plot, with tick numbers running along both arms of the cross.
🎯 Your Turn: Fill in the Blanks
Replace each ___ to hide the top and right spines of this scatter plot.
import matplotlib.pyplot as plt
import numpy as np

x = np.random.rand(30)
y = np.random.rand(30)

fig, ax = plt.subplots()
ax.scatter(x, y, color="seagreen")

# Hide the top spine
ax.spines["___"].set_visible(False)

# Hide the right spine
ax.spines["right"].set_visible(___)

ax.set_title("Clean Scatter")

# Display the figure
plt.___()
📋 Common Errors & Quick Reference
Spine names are lowercase. ✅ Use 'top', 'bottom', 'left', 'right' — never capitalized.
❌ I moved a spine but the ticks stayed put
Moving a spine does not move the ticks. ✅ Call ax.xaxis.set_ticks_position('bottom') and ax.yaxis.set_ticks_position('left') after repositioning.
Spines live on an Axes, not on plt. ✅ Get an axes first with fig, ax = plt.subplots(), then use ax.spines[...].
| Call | What It Does |
|---|---|
| ax.spines['top'].set_visible(False) | Hides a spine |
| .set_color('navy') | Recolors a spine |
| .set_linewidth(2) | Thickens a spine |
| .set_bounds(low, high) | Shortens a spine |
| .set_position('zero') | Moves a spine to value 0 |
🎯 Mini-Challenge: A Polished Cosine
Plot a cosine curve, hide the top and right spines, recolor the left and bottom spines gray, and thicken them to 1.5.
import matplotlib.pyplot as plt
import numpy as np

x = np.linspace(0, 4 * np.pi, 200)
y = np.cos(x)

fig, ax = plt.subplots()
ax.plot(x, y, color="dodgerblue", linewidth=2)

# Clean frame: hide two, restyle two
for side in ["top", "right"]:
    ax.spines[side].set_visible(False)

for side in ["left", "bottom"]:
    ax.spines[side].set_color("gray")
    ax.spines[side].set_linewidth(1.5)

ax.set_title("Polished Cosine")
ax.set_xlabel("x")
ax.set_ylabel("cos(x)")

plt.show()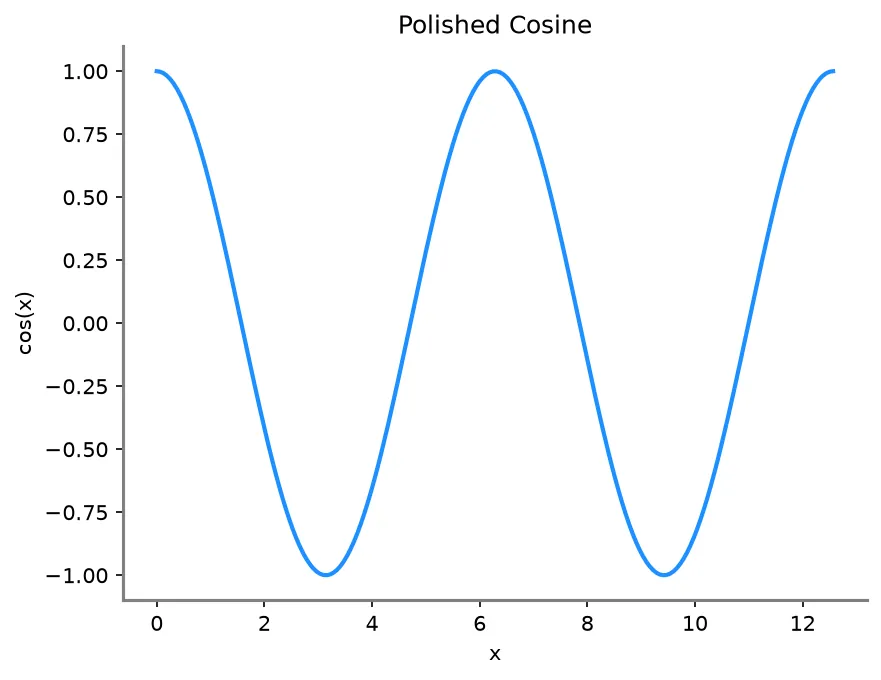
import matplotlib.pyplot as plt

fig, ax = plt.subplots()
ax.plot([-3, -1, 0, 1, 3], [9, 1, 0, 1, 9])

ax.spines["top"].set_visible(False)
ax.spines["right"].set_visible(False)
ax.spines["left"].set_position(("data", 0))
ax.spines["bottom"].set_position(("data", 0))

print("Spines by name:", sorted(ax.spines.keys()))
print("Top visible:   ", ax.spines["top"].get_visible())
print("Right visible: ", ax.spines["right"].get_visible())
print("Bottom visible:", ax.spines["bottom"].get_visible())
print("Left sits at:", ax.spines["left"].get_position())
print("Two spines left showing:", sum(ax.spines[s].get_visible() for s in ax.spines))

# ✅ Expected output:
# Spines by name: ['bottom', 'left', 'right', 'top']
# Top visible:    False
# Right visible:  False
# Bottom visible: True
# Left sits at: ('data', 0)
# Two spines left showing: 2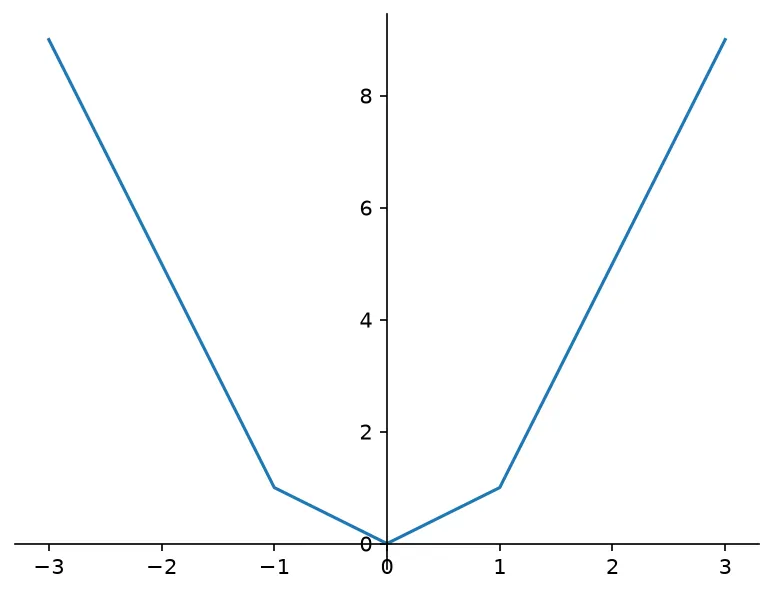
❓ Frequently Asked Questions
Lesson complete — you control the frame!
You hid the top and right spines, recolored and thickened the rest, shortened a spine with bounds, and centered the axes at the origin for a math-textbook look.
Practice quiz
What are the four spines of an Axes?
- north, south, east, west
- top, bottom, left, right
- x, y, z, w
- up, down, in, out
Answer: top, bottom, left, right. Spines are keyed 'top', 'bottom', 'left', and 'right' in ax.spines.
How do you hide the top spine?
- ax.spines['top'].set_visible(False)
- ax.spines['top'].hide()
- ax.hide_spine('top')
- ax.spines.remove('top')
Answer: ax.spines['top'].set_visible(False). set_visible(False) on the spine hides it.
Where do spines live?
- On plt
- On the Figure
- On the colorbar
- On the Axes (ax.spines)
Answer: On the Axes (ax.spines). Spines belong to an Axes; access them via ax.spines[...].
Which call moves the left spine to the data value 0?
- ax.spines['left'].set_position('zero')
- ax.spines['left'].move(0)
- ax.spines['left'].set_zero()
- ax.spines['left'].center()
Answer: ax.spines['left'].set_position('zero'). set_position('zero') moves the spine to data value 0.
Which method shortens a spine to part of the axis?
- set_length()
- set_range()
- set_bounds(low, high)
- set_limit()
Answer: set_bounds(low, high). set_bounds(low, high) draws the spine only across that range.
Which call recolors a spine to navy?
- ax.spines['left'].color('navy')
- ax.spines['left'].set_color('navy')
- ax.spines['left'].paint('navy')
- ax.set_spine_color('navy')
Answer: ax.spines['left'].set_color('navy'). set_color('navy') changes the spine's color.
Why might ticks stay put after you move a spine?
- Moving a spine does not move ticks
- Ticks are broken
- You must call plt.show() twice
- set_position deletes ticks
Answer: Moving a spine does not move ticks. Call ax.xaxis.set_ticks_position(...) to make ticks follow the moved spine.
What does ax.spines['left'].set_linewidth(2.5) do?
- Hides the spine
- Moves the spine
- Recolors the spine
- Thickens the spine
Answer: Thickens the spine. set_linewidth changes the spine's thickness in points.
Why does ax.spines['Top'] raise KeyError?
- Spines are uppercase
- Spine names are lowercase
- Top is not a spine
- It needs an index
Answer: Spine names are lowercase. Spine names are lowercase: use 'top', not 'Top'.
Which is the single most common spine tweak?
- Coloring all spines red
- Moving every spine to zero
- Hiding the top and right spines
- Thickening the bottom spine
Answer: Hiding the top and right spines. Hiding the top and right spines gives charts a clean, modern look.
Continue this course
- Previous: Vector Fields (quiver & streamplot)
- Next: Advanced Legends — Place legends outside the axes, use custom handles, and multiple legends
- Quick reference: Matplotlib cheat sheet
Frequently asked questions
What exactly is a spine in Matplotlib?
A spine is one of the four lines that form the border of the plotting area: 'top', 'bottom', 'left', and 'right'. They are stored in ax.spines, a dictionary keyed by those names, and each one is an artist you can hide, recolor, move, or shorten independently.
How do I remove the top and right borders for a cleaner chart?
Set their visibility to False: ax.spines['top'].set_visible(False) and ax.spines['right'].set_visible(False). This is the single most common spine tweak and instantly gives a chart a lighter, more modern look by removing the box around it.
How do I move the x and y axes so they cross at the origin?
Use set_position. Call ax.spines['left'].set_position('zero') and ax.spines['bottom'].set_position('zero') to move those spines to the data value 0, then hide the top and right spines. This creates the classic math-textbook look where the axes form a cross through (0, 0).
Can I shorten a spine so it does not span the whole axis?
Yes — call set_bounds(low, high) on the spine. For example ax.spines['left'].set_bounds(0, 5) draws the left spine only between y = 0 and y = 5, which is handy for emphasizing the range your data actually occupies.