Vector Fields (quiver & streamplot)
Reviewed & published by Brayan K
A vector field plot draws an arrow at each point in a grid to show direction and strength, letting you visualize forces, winds, currents, or any quantity that has both a magnitude and a heading.
Part of the free Matplotlib course at LearnCodingFast — hands-on lessons with worked examples and the output they print, plus practice exercises and a quick quiz.
In this lesson you'll build arrow grids with ax.quiver(), trace smooth flow lines with ax.streamplot(), control arrow scale and line density, and color both by magnitude.
What You'll Learn in This Lesson
- Building a meshgrid of X, Y coordinates with numpy
- Drawing arrows from U, V components with ax.quiver()
- Controlling arrow length with the scale argument
- Tracing continuous flow lines with ax.streamplot()
- Adjusting streamline density
- Coloring arrows and streamlines by magnitude
1 Your First Quiver Plot
A quiver plot needs four ingredients: the X and Y positions of each arrow and the U and V components of the vector at that position. U is how far the arrow points along x, V is how far along y. You almost always build the positions with np.meshgrid(), which turns two 1-D ranges into a full 2-D grid of coordinates.
import matplotlib.pyplot as plt
import numpy as np

# A 6x6 grid of positions
x = np.linspace(-2, 2, 6)
y = np.linspace(-2, 2, 6)
X, Y = np.meshgrid(x, y)

# A simple rotating field: arrows swirl around the origin
U = -Y
V = X

fig, ax = plt.subplots()
ax.quiver(X, Y, U, V, color="steelblue")

ax.set_title("A Rotating Vector Field")
ax.set_aspect("equal")
ax.grid(True, linestyle="--", alpha=0.4)

plt.show()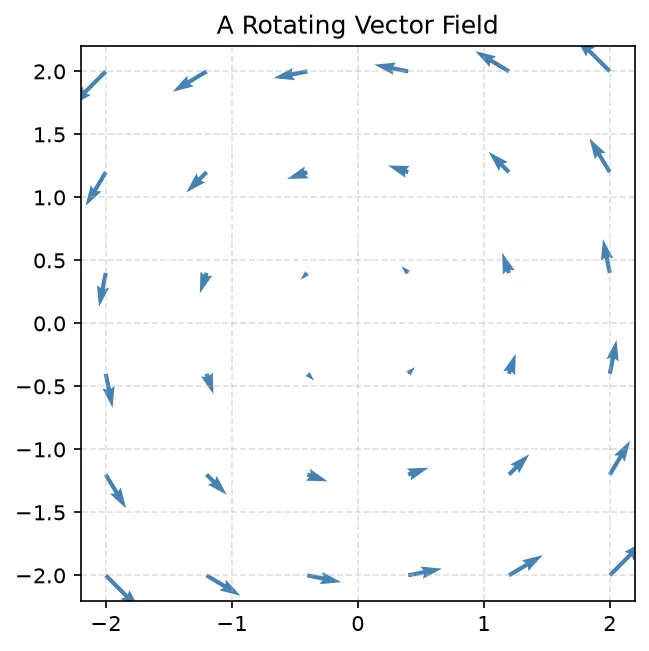
What you'll see: a 6×6 grid of blue arrows that curl counter-clockwise around the center — short near the middle and longer toward the edges — because the field U = −Y, V = X gets stronger the farther you move from the origin.
2 Scaling Arrows & Coloring by Magnitude
By default Matplotlib auto-scales arrow length to fit the axes. Pass scale to take control: a larger scale makes arrows shorter, a smaller scale makes them longer. To color arrows by strength, compute the magnitude with np.sqrt(U**2 + V**2) and pass it as the fifth argument — Matplotlib runs it through a colormap.
import matplotlib.pyplot as plt
import numpy as np

x = np.linspace(-3, 3, 12)
y = np.linspace(-3, 3, 12)
X, Y = np.meshgrid(x, y)

# A field that flows outward and twists
U = X - Y
V = X + Y

# Magnitude controls the arrow color
M = np.sqrt(U**2 + V**2)

fig, ax = plt.subplots()
q = ax.quiver(X, Y, U, V, M, cmap="plasma", scale=40)
fig.colorbar(q, ax=ax, label="Vector strength")

ax.set_title("Arrows Colored by Magnitude")
ax.set_aspect("equal")

plt.show()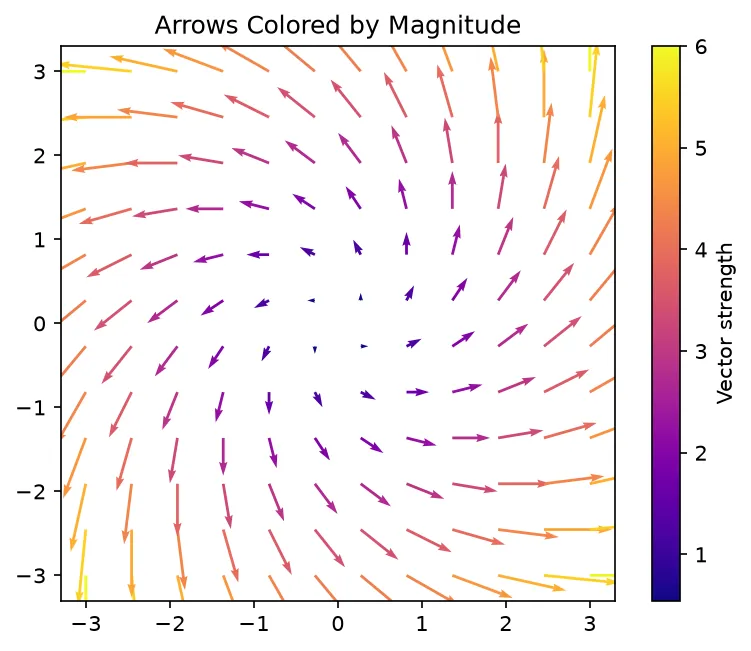
3 Flow Lines With streamplot
Where quiver shows discrete arrows, ax.streamplot() traces the continuous paths a particle would follow through the field. It takes the same X, Y, U, V data but draws smooth curves with little arrowheads. Use density to pack in more or fewer lines, and pass an array to color to tint the streamlines by magnitude.
import matplotlib.pyplot as plt
import numpy as np

x = np.linspace(-3, 3, 60)
y = np.linspace(-3, 3, 60)
X, Y = np.meshgrid(x, y)

# A swirling vortex field
U = -Y
V = X

speed = np.sqrt(U**2 + V**2)

fig, ax = plt.subplots()
strm = ax.streamplot(X, Y, U, V, color=speed,
                     cmap="cool", density=1.4, linewidth=1.2)
fig.colorbar(strm.lines, ax=ax, label="Speed")

ax.set_title("Streamlines of a Vortex")
ax.set_aspect("equal")

plt.show()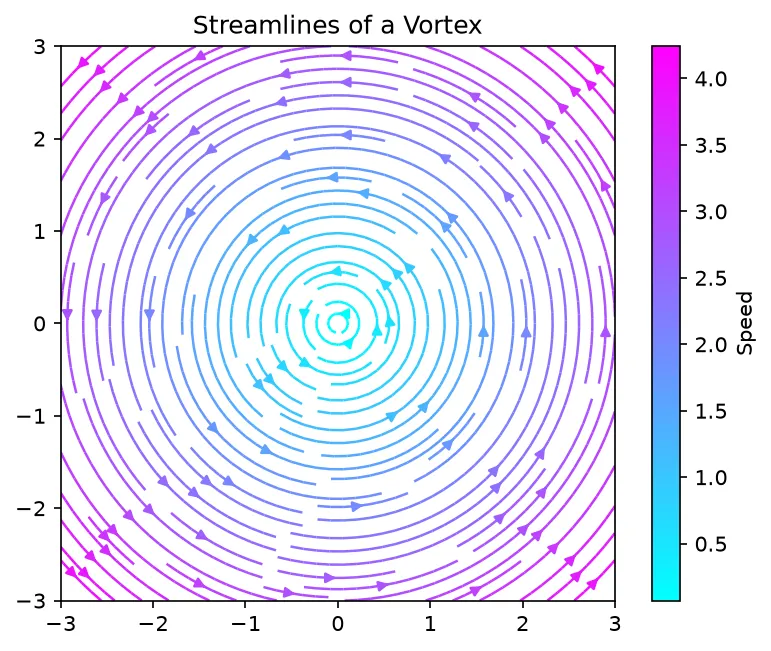
What you'll see: smooth concentric loops swirling around the center, each carrying a tiny arrowhead, tinted from cool blue near the calm middle to brighter colors where the flow speeds up at the edges.
🎯 Your Turn: Fill in the Blanks
Replace each ___ to draw a quiver field of a uniform wind blowing up and to the right.
import matplotlib.pyplot as plt
import numpy as np

# Build a grid of positions
X, Y = np.___(np.arange(0, 6), np.arange(0, 6))

# Every arrow points the same way: 1 right, 1 up
U = np.ones_like(X)
V = np.ones_like(Y)

fig, ax = plt.subplots()

# Draw the arrows
ax.___(X, Y, U, V, color="darkgreen")

ax.set_title("Steady Wind")
ax.set_aspect("equal")

# Display the figure
plt.___()
📋 Common Errors & Quick Reference
❌ All arrows squashed into dots
Your scale is too high, so arrows are shrunk to nothing. ✅ Lower the scale, or drop the argument entirely and let Matplotlib auto-scale.
❌ streamplot: "The rows of 'x' must be equal"
streamplot needs an evenly spaced, strictly increasing grid. ✅ Build X and Y with np.linspace + np.meshgrid, not hand-typed lists.
❌ Shape mismatch between X, Y and U, V
U and V must have the same 2-D shape as X and Y. ✅ Derive U and V from X and Y (e.g. U = -Y) so the shapes always line up.
| Call | What It Does |
|---|---|
| np.meshgrid(x, y) | Builds the 2-D X, Y position grid |
| ax.quiver(X, Y, U, V) | Draws one arrow per grid point |
| ax.quiver(..., M, cmap=) | Colors arrows by magnitude M |
| ax.streamplot(X, Y, U, V) | Traces continuous flow lines |
| density= | How tightly streamlines are packed |
🎯 Mini-Challenge: Quiver Over Streamlines
Overlay a coarse quiver field on top of fine streamlines of the same vortex, so you see both the individual arrows and the overall flow.
import matplotlib.pyplot as plt
import numpy as np

# Fine grid for smooth streamlines
xf = np.linspace(-3, 3, 50)
yf = np.linspace(-3, 3, 50)
Xf, Yf = np.meshgrid(xf, yf)
Uf, Vf = -Yf, Xf

# Coarse grid for readable arrows
xc = np.linspace(-3, 3, 10)
yc = np.linspace(-3, 3, 10)
Xc, Yc = np.meshgrid(xc, yc)
Uc, Vc = -Yc, Xc

fig, ax = plt.subplots()

# Flow lines underneath, faint
ax.streamplot(Xf, Yf, Uf, Vf, color="lightgray", density=1.2)

# Bold magnitude-colored arrows on top
M = np.sqrt(Uc**2 + Vc**2)
q = ax.quiver(Xc, Yc, Uc, Vc, M, cmap="viridis", scale=60)
fig.colorbar(q, ax=ax, label="strength")

ax.set_title("Quiver + Streamlines")
ax.set_aspect("equal")

plt.show()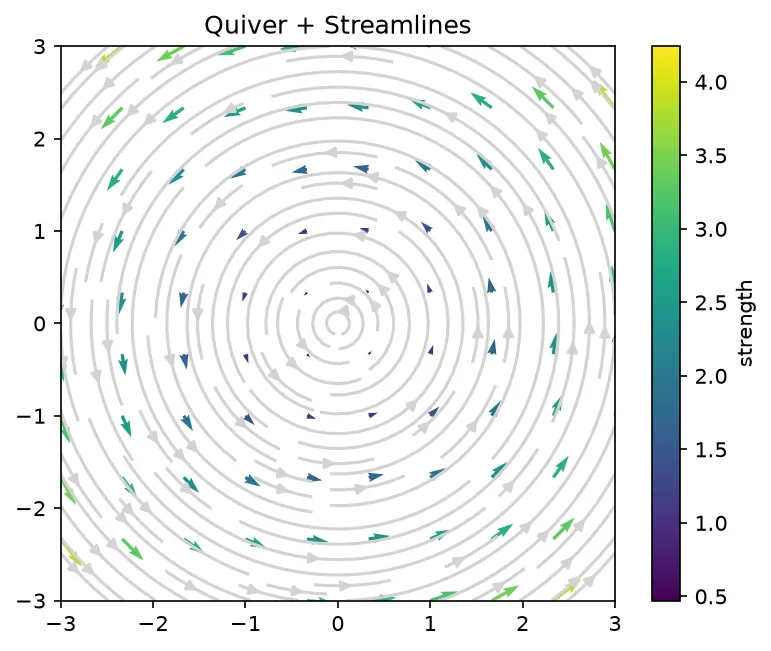
import matplotlib.pyplot as plt

xs = [0, 1, 2]
ys = [0, 1, 2]
u = [1, 0, -1]
v = [0, 1, 1]

fig, ax = plt.subplots()
q = ax.quiver(xs, ys, u, v, angles="xy", scale_units="xy", scale=1)
ax.set_xlim(-1, 4)
ax.set_ylim(-1, 4)

lengths = [round((a * a + b * b) ** 0.5, 3) for a, b in zip(u, v)]
print("Arrows:", len(q.U))
print("Components U:", [int(a) for a in q.U])
print("Components V:", [int(b) for b in q.V])
print("Lengths:", lengths)
print("Longest arrow:", max(lengths))
print("Arrow 1 points straight right:", u[0] == 1 and v[0] == 0)

# ✅ Expected output:
# Arrows: 3
# Components U: [1, 0, -1]
# Components V: [0, 1, 1]
# Lengths: [1.0, 1.0, 1.414]
# Longest arrow: 1.414
# Arrow 1 points straight right: True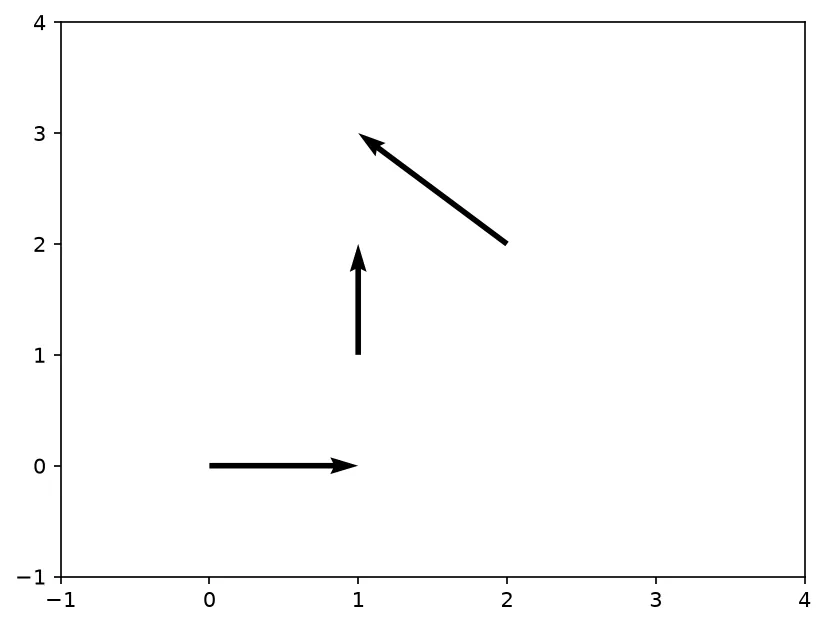
❓ Frequently Asked Questions
Lesson complete — you can visualize vector fields!
You built coordinate grids with meshgrid, drew arrow fields with quiver, scaled them and colored them by magnitude, and traced smooth flow lines with streamplot.
Practice quiz
How many arrays does ax.quiver() need for X, Y positions and U, V components?
- Two
- Three
- Four
- Five
Answer: Four. quiver takes X, Y, U, V — four arrays for positions and vector components.
What does np.meshgrid() build for a quiver plot?
- A 2D grid of coordinates
- A list of colors
- A single 1D range
- A colormap
Answer: A 2D grid of coordinates. np.meshgrid turns two 1D ranges into a full 2D grid of X, Y coordinates.
In ax.quiver, what do U and V represent?
- The grid spacing
- The arrow color and size
- The figure width and height
- The x and y components of each vector
Answer: The x and y components of each vector. U is the component along x and V is the component along y at each point.
How does the scale argument affect arrow length?
- Larger scale makes arrows shorter
- Larger scale makes arrows longer
- Scale only changes color
- Scale has no effect on length
Answer: Larger scale makes arrows shorter. scale is inverted: a larger scale shrinks arrows, a smaller scale lengthens them.
How do you compute the magnitude of vectors U and V?
- np.abs(U + V)
- np.sqrt(U**2 + V**2)
- U * V
- np.max(U, V)
Answer: np.sqrt(U**2 + V**2). The magnitude is np.sqrt(U**2 + V**2) at each grid point.
Which method traces continuous flow lines through the field?
- ax.flowline()
- ax.contour()
- ax.quiver()
- ax.streamplot()
Answer: ax.streamplot(). ax.streamplot() draws smooth curves following the vector field.
What does the density argument control in streamplot?
- The arrow head size
- The line color
- How many streamlines are drawn
- The grid spacing
Answer: How many streamlines are drawn. density sets how tightly the streamlines are packed; 1 is the default.
To color quiver arrows by magnitude M, where do you pass M?
- As a keyword color=M only
- As the fifth positional argument ax.quiver(X, Y, U, V, M)
- As the first argument
- It cannot be done
Answer: As the fifth positional argument ax.quiver(X, Y, U, V, M). Pass M as the fifth positional argument; Matplotlib maps it through a colormap.
What kind of grid does streamplot require?
- A random scatter of points
- Any hand-typed list of points
- Only integer coordinates
- An evenly spaced, strictly increasing grid
Answer: An evenly spaced, strictly increasing grid. streamplot needs an evenly spaced, strictly increasing grid from linspace + meshgrid.
Which argument picks the colormap for magnitude-colored arrows?
- palette=
- colors=
- cmap=
- shade=
Answer: cmap=. cmap= selects the colormap, e.g. cmap='viridis'.
Continue this course
- Previous: Checkpoint: Advanced Plotting
- Next: Customizing Spines & Axis Position — Hide, move, and restyle the axis spines for a clean look
- Quick reference: Matplotlib cheat sheet
Frequently asked questions
What is the difference between quiver and streamplot?
ax.quiver() draws a discrete arrow at every grid point, showing the direction and magnitude of a vector at that exact spot. ax.streamplot() instead traces continuous curves that follow the flow, the way a leaf would drift on water. Use quiver when you care about individual vectors and streamplot when you care about the overall flow pattern.
Why are my quiver arrows too long or too short?
By default Matplotlib auto-scales arrows to fit the axes. To control length pass the scale argument: a larger scale makes arrows shorter, a smaller scale makes them longer. You can also set scale_units and angles='xy', scale_units='xy', scale=1 to make one data unit equal one arrow unit.
How do I color quiver arrows by their magnitude?
Compute the magnitude with numpy, for example M = np.sqrt(U**2 + V**2), then pass M as the third positional argument: ax.quiver(X, Y, U, V, M). Matplotlib maps the magnitude through a colormap so longer, stronger vectors stand out in a different color.
What does the density argument do in streamplot?
density controls how many streamlines Matplotlib draws. density=1 is the default; raising it to 2 or 3 packs in more lines for a denser picture of the flow, while a value below 1 thins them out. You can also pass a tuple like density=(2, 1) to set horizontal and vertical density separately.