Logarithmic & Symlog Scales
Reviewed & published by Brayan K
A logarithmic scale spaces an axis by powers rather than by equal steps, so data spanning many orders of magnitude fits in one chart and exponential growth straightens into a readable line.
Part of the free Matplotlib course at LearnCodingFast — hands-on lessons with worked examples and the output they print, plus practice exercises and a quick quiz.
In this lesson you'll switch axes to log with set_yscale('log'), use the loglog/semilogx/semilogy shortcuts, handle zeros and negatives with symlog, and tidy log ticks.
What You'll Learn in This Lesson
- Switching an axis to a log scale
- Using semilogy, semilogx, and loglog
- Seeing exponential growth as a straight line
- Handling zeros and negatives with symlog
- Stretching probabilities with the logit scale
- Formatting ticks on a log axis
1 From Linear to Log
When values explode across magnitudes, a linear axis crushes the small numbers into a flat line near zero. Flip the axis with ax.set_yscale('log') and each gridline becomes a power of ten, so 1, 10, 100, and 1000 are evenly spaced and all visible at once.
import matplotlib.pyplot as plt
import numpy as np

x = np.arange(0, 10)
y = 2 ** x   # 1, 2, 4, ... up to 512

fig, (ax1, ax2) = plt.subplots(1, 2, figsize=(10, 4))

# Left: linear — small values look flat
ax1.plot(x, y, marker="o", color="crimson")
ax1.set_title("Linear y-axis")

# Right: log — the same data is a straight line
ax2.plot(x, y, marker="o", color="teal")
ax2.set_yscale("log")
ax2.set_title("Log y-axis")

fig.tight_layout()
plt.show()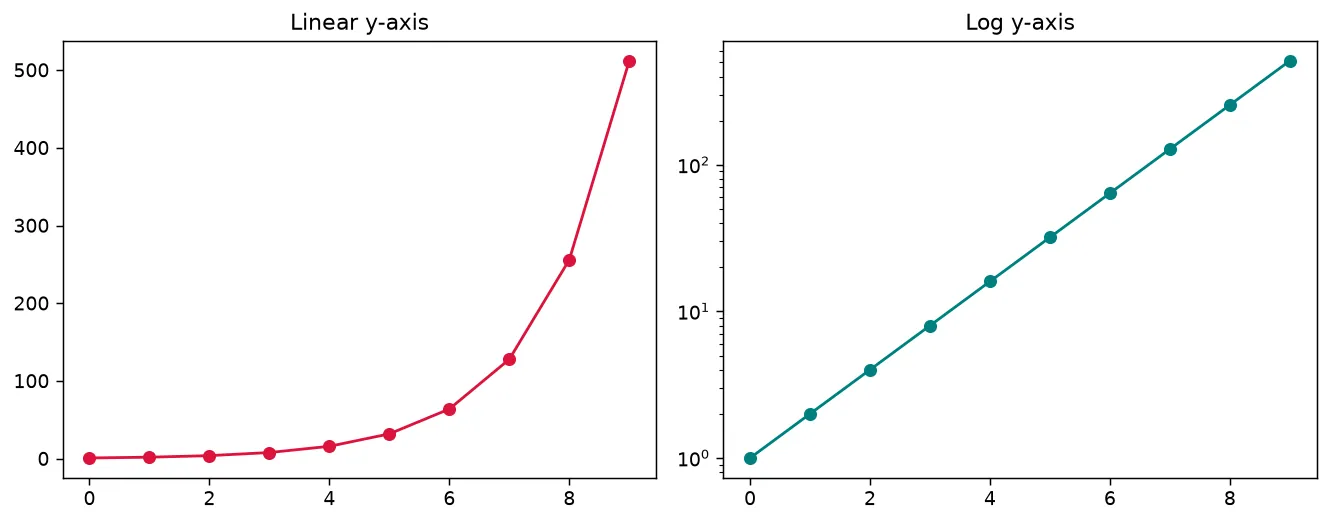
What you'll see: two panels of the same doubling data — on the left the early values hug the bottom while the last point shoots up, but on the right the log axis turns the whole series into a clean straight line.
2 loglog, semilogx & semilogy
Matplotlib offers one-call shortcuts that plot and set the scale together. ax.semilogy() logs the y-axis, ax.semilogx() logs the x-axis, and ax.loglog() logs both. A power law like y = x² becomes a straight line on a loglog plot, with the slope revealing the exponent.
import matplotlib.pyplot as plt
import numpy as np

x = np.logspace(0, 3, 50)   # 1 to 1000, log-spaced
y = x ** 2                  # a power law

fig, ax = plt.subplots()

# One call plots AND logs both axes
ax.loglog(x, y, marker=".", color="purple")

ax.set_title("Power Law on a loglog Plot")
ax.set_xlabel("x")
ax.set_ylabel("y = x squared")
ax.grid(True, which="both", linestyle="--", alpha=0.4)

plt.show()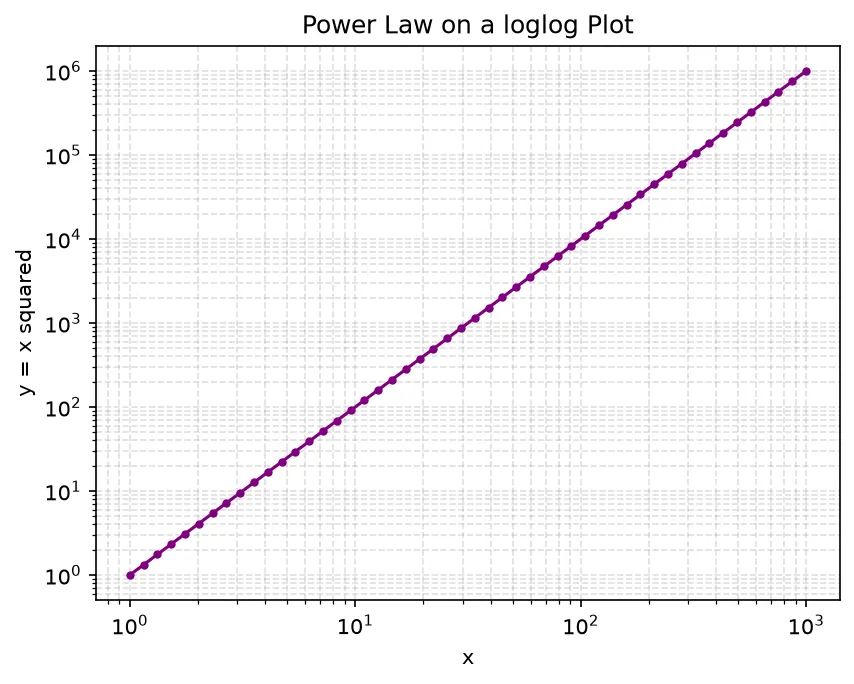
3 Zeros & Negatives With symlog
A plain log scale cannot show zero or negative values. symlog (symmetric log) fixes this: it is linear in a small band around zero — set by linthresh — and logarithmic beyond it on both sides. That makes it perfect for data that crosses zero yet still spans large magnitudes.
import matplotlib.pyplot as plt
import numpy as np

x = np.linspace(-100, 100, 400)
y = x ** 3   # ranges from -10^6 to +10^6 and passes through 0

fig, ax = plt.subplots()
ax.plot(x, y, color="darkgreen")

# Symlog: linear within +/-100, log outside it
ax.set_yscale("symlog", linthresh=100)

ax.set_title("Cubic on a symlog Axis")
ax.set_xlabel("x")
ax.set_ylabel("x cubed")
ax.grid(True, linestyle="--", alpha=0.4)

plt.show()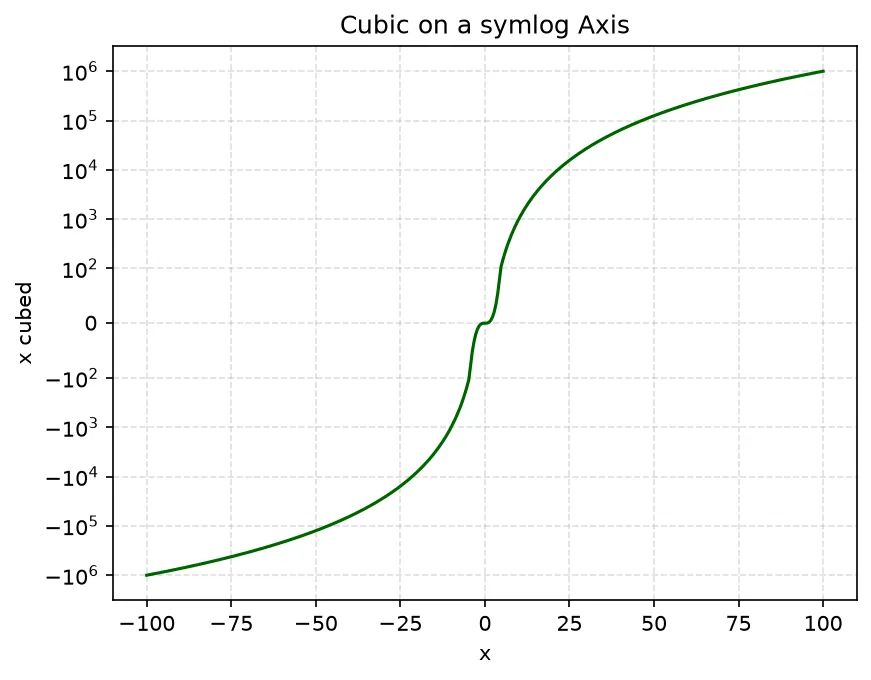
What you'll see: the cubic curve sweeping from large negative to large positive values through zero — the symlog axis keeps the small middle readable while compressing the enormous tails on both ends.
🎯 Your Turn: Fill in the Blanks
Replace each ___ to plot growth data on a log y-axis.
import matplotlib.pyplot as plt
import numpy as np

days = np.arange(0, 15)
cases = 3 ** days   # tripling every day

fig, ax = plt.subplots()
ax.plot(days, cases, marker="o", color="darkred")

# Make the y-axis logarithmic
ax.set_yscale("___")

ax.set_title("Exponential Growth")
ax.set_xlabel("Day")
ax.set_ylabel("Cases")

# Display the figure
plt.___()
📋 Common Errors & Quick Reference
❌ My log plot is blank or warns about non-positive data
Log cannot handle 0 or negatives. ✅ Filter them out, or use set_yscale('symlog') which spans zero.
❌ symlog ignores my zero-crossing
The linear band is the wrong size. ✅ Tune linthresh= to roughly the smallest magnitude you care about.
❌ logit raised a ValueError
logit needs values strictly between 0 and 1. ✅ Keep your data inside the open interval (0, 1) — no exact 0 or 1.
| Call | What It Does |
|---|---|
| ax.set_yscale('log') | Log y-axis |
| ax.semilogy(x, y) | Plot + log y in one call |
| ax.loglog(x, y) | Plot + log both axes |
| set_yscale('symlog', linthresh=1) | Log that spans zero |
| set_yscale('logit') | Stretch probabilities near 0 and 1 |
🎯 Mini-Challenge: Compare Three Growth Rates
Plot linear, quadratic, and exponential growth on a semilog y-axis so their very different scales all fit.
import matplotlib.pyplot as plt
import numpy as np

t = np.arange(1, 15)

fig, ax = plt.subplots()
ax.semilogy(t, t, marker="o", label="linear: t")
ax.semilogy(t, t ** 2, marker="s", label="quadratic: t^2")
ax.semilogy(t, 2.0 ** t, marker="^", label="exponential: 2^t")

ax.set_title("Three Growth Rates on a Log Axis")
ax.set_xlabel("t")
ax.set_ylabel("value (log)")
ax.legend()
ax.grid(True, which="both", linestyle="--", alpha=0.4)

plt.show()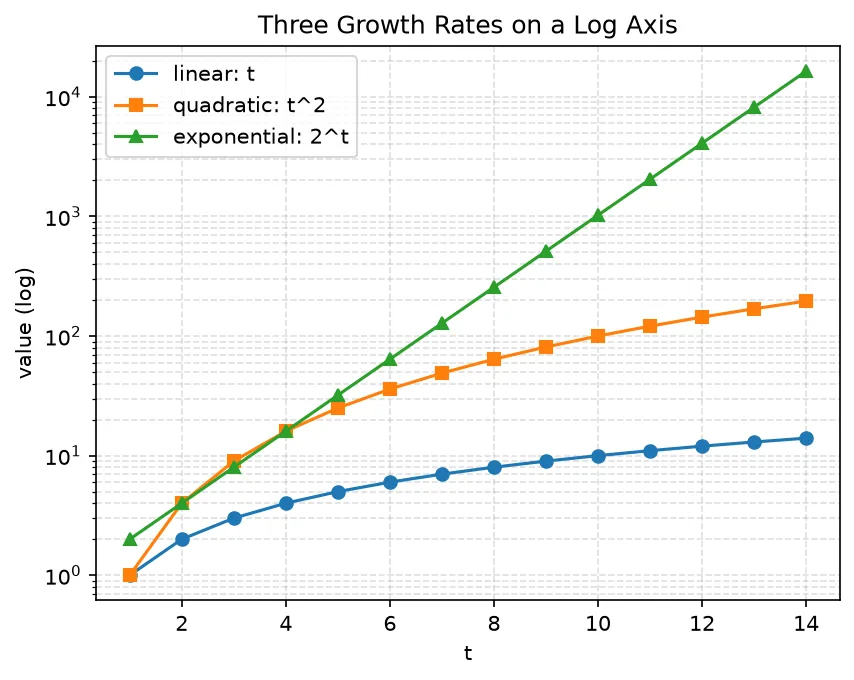
import matplotlib.pyplot as plt

x = [1, 2, 3, 4, 5]
y = [10, 100, 1000, 10000, 100000]

fig, ax = plt.subplots()
ax.plot(x, y, marker="o")
ax.set_yscale("log")

fig.canvas.draw()

print("Y scale:", ax.get_yscale())
print("X scale:", ax.get_xscale())
print("Y tick positions:", [int(v) for v in ax.get_yticks() if v >= 1][:6])
print("Each step is 10x:", all(y[i + 1] / y[i] == 10 for i in range(len(y) - 1)))
print("Straight line on a log axis:", len(set(round(y[i+1]/y[i], 6) for i in range(len(y)-1))) == 1)

# ✅ Expected output:
# Y scale: log
# X scale: linear
# Y tick positions: [1, 10, 100, 1000, 10000, 100000]
# Each step is 10x: True
# Straight line on a log axis: True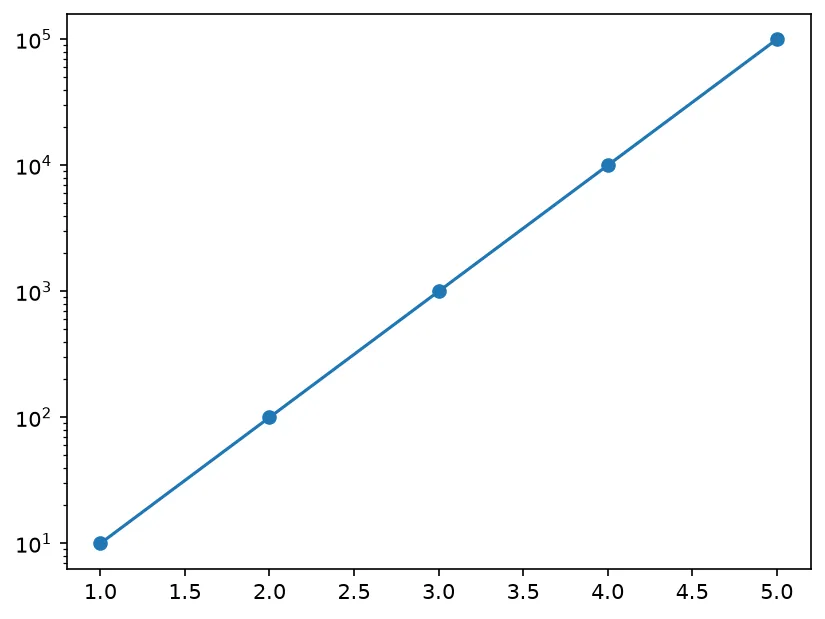
❓ Frequently Asked Questions
Lesson complete — magnitudes hold no fear!
You switched axes to log, used the semilog and loglog shortcuts, recognized exponential growth as a straight line, and handled zeros and negatives with symlog.
Practice quiz
Which call switches an existing y-axis to a logarithmic scale?
- ax.logy()
- ax.set_ylog()
- ax.set_yscale('log')
- ax.yscale(log=True)
Answer: ax.set_yscale('log'). ax.set_yscale('log') flips the y-axis to a log scale.
On a log axis, what does a straight line indicate?
- Exponential growth
- Linear growth
- Constant data
- Random noise
Answer: Exponential growth. Equal distances on a log axis are equal ratios, so exponential growth becomes a straight line.
Which shortcut plots and logs BOTH axes in one call?
- ax.semilogx()
- ax.semilogy()
- ax.plot(log=True)
- ax.loglog()
Answer: ax.loglog(). ax.loglog(x, y) plots and sets both axes to log.
What does ax.semilogy(x, y) do?
- Logs both axes
- Plots and logs only the y-axis
- Logs only the x-axis
- Plots with no log scale
Answer: Plots and logs only the y-axis. semilogy logs the y-axis only while plotting in one call.
Why does a plain log scale fail on zero or negative data?
- It needs integers
- It requires sorted data
- The log of zero is undefined and of a negative is complex
- It only works on the x-axis
Answer: The log of zero is undefined and of a negative is complex. log(0) is undefined and log of a negative is complex, so those points drop or error.
Which scale handles data that crosses zero across large magnitudes?
- log
- logit
- linear
- symlog
Answer: symlog. symlog is linear near zero and logarithmic beyond it, so it spans zero and negatives.
What does the linthresh parameter control on a symlog scale?
- The width of the linear band around zero
- The color of the axis
- The number of ticks
- The line width
Answer: The width of the linear band around zero. linthresh sets how wide the linear region around zero is before the log behavior begins.
Which scale stretches values near 0 and near 1 for probabilities?
- symlog
- logit
- log
- linear
Answer: logit. The logit scale stretches regions near 0 and 1, ideal for proportions in (0, 1).
What does which='both' do in ax.grid() on a log axis?
- Logs both axes
- Removes the grid
- Doubles the figure
- Shows major and minor gridlines
Answer: Shows major and minor gridlines. which='both' draws major and minor gridlines, including the faint minor lines within each decade.
What input does the logit scale require?
- Any real numbers
- Only integers
- Values strictly between 0 and 1
- Only negative values
Answer: Values strictly between 0 and 1. logit needs values strictly in the open interval (0, 1) — no exact 0 or 1.
Continue this course
- Previous: Adding Tables to Plots
- Next: More Plot Types: eventplot, broken_barh, stairs — Timelines, Gantt-style bars, and step outlines
- Quick reference: Matplotlib cheat sheet
Frequently asked questions
When should I use a logarithmic scale?
Reach for a log scale when your data spans several orders of magnitude — say values from 1 to 1,000,000 — or when you care about multiplicative change like growth rates. On a log axis equal distances represent equal ratios, so exponential growth becomes a straight line and small and large values are both readable in one chart.
What is the difference between set_yscale('log') and semilogy()?
They do the same thing in two styles. ax.set_yscale('log') flips an existing axes to a log y-axis, while ax.semilogy(x, y) is a shortcut that plots and sets the log y-scale in one call. Similarly semilogx logs the x-axis and loglog logs both. Use whichever reads more cleanly in your code.
Why does my log plot fail or show gaps with zero or negative data?
The logarithm of zero is undefined and of a negative number is complex, so a plain log scale drops or errors on those points. Use 'symlog' instead: it is linear in a small band around zero and logarithmic beyond it, so it handles zeros and negatives gracefully while still compressing large magnitudes.
What is the logit scale for?
The logit scale is designed for probabilities and proportions strictly between 0 and 1. It stretches the regions near 0 and near 1 so differences like 0.99 versus 0.999 become visible, which a linear axis would squash together. Set it with ax.set_yscale('logit') when plotting things like accuracy or survival fractions.