More Plot Types: eventplot, broken_barh, stairs
Reviewed & published by Brayan K
Beyond lines and bars, Matplotlib ships specialized plot types — eventplot for timelines, broken_barh for Gantt charts, stairs for step outlines, and bxp for precomputed boxplots.
Part of the free Matplotlib course at LearnCodingFast — hands-on lessons with worked examples and the output they print, plus practice exercises and a quick quiz.
In this lesson you'll raster event timelines with ax.eventplot(), build Gantt-style rows with ax.broken_barh(), draw step outlines with ax.stairs(), and render boxplots from stats with ax.bxp().
What You'll Learn in This Lesson
- Rastering events with ax.eventplot()
- Comparing multiple event rows
- Building Gantt rows with ax.broken_barh()
- Drawing step outlines with ax.stairs()
- Filling a histogram outline
- Rendering precomputed boxplots with ax.bxp()
1 Timelines With eventplot
ax.eventplot() draws a tick at every position you give it — a raster. Hand it a single array for one row, or a list of arrays for several stacked rows, perfect for comparing when events fired across different sources.
import matplotlib.pyplot as plt
import numpy as np

rng = np.random.default_rng(3)

# Three sensors, each firing at random times in 0..10
sensors = [np.sort(rng.uniform(0, 10, n)) for n in (12, 8, 15)]

fig, ax = plt.subplots()
ax.eventplot(sensors, colors=["crimson", "teal", "purple"],
             lineoffsets=[1, 2, 3], linelengths=0.8)

ax.set_yticks([1, 2, 3])
ax.set_yticklabels(["Sensor A", "Sensor B", "Sensor C"])
ax.set_xlabel("Time (s)")
ax.set_title("Event Raster")

plt.show()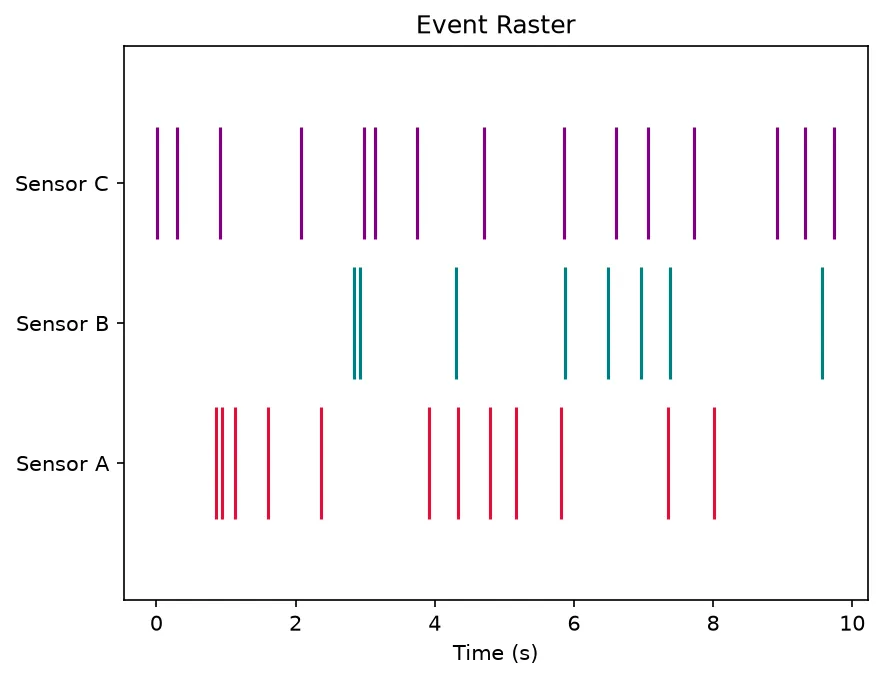
What you'll see: three colored rows of vertical tick marks, one per sensor, each tick landing at the moment that sensor fired — an at-a-glance timeline of who triggered when.
2 Gantt Rows With broken_barh
ax.broken_barh(xranges, yrange) draws horizontal bars from (start, width) pairs at a given (y, height). One call can place several segments — gaps and all — on a single row, which is exactly what a Gantt chart needs: one task per row spanning its active periods.
import matplotlib.pyplot as plt

fig, ax = plt.subplots()

# Each row: list of (start, duration) blocks at a (y, height)
ax.broken_barh([(0, 3), (4, 2)], (10, 8),
               facecolors="tab:blue")     # Design
ax.broken_barh([(3, 4)], (20, 8),
               facecolors="tab:orange")   # Build
ax.broken_barh([(7, 2), (10, 3)], (30, 8),
               facecolors="tab:green")    # Test

ax.set_ylim(5, 42)
ax.set_xlim(0, 14)
ax.set_xlabel("Week")
ax.set_yticks([14, 24, 34])
ax.set_yticklabels(["Design", "Build", "Test"])
ax.set_title("Project Gantt Chart")
ax.grid(True, axis="x", linestyle="--", alpha=0.4)

plt.show()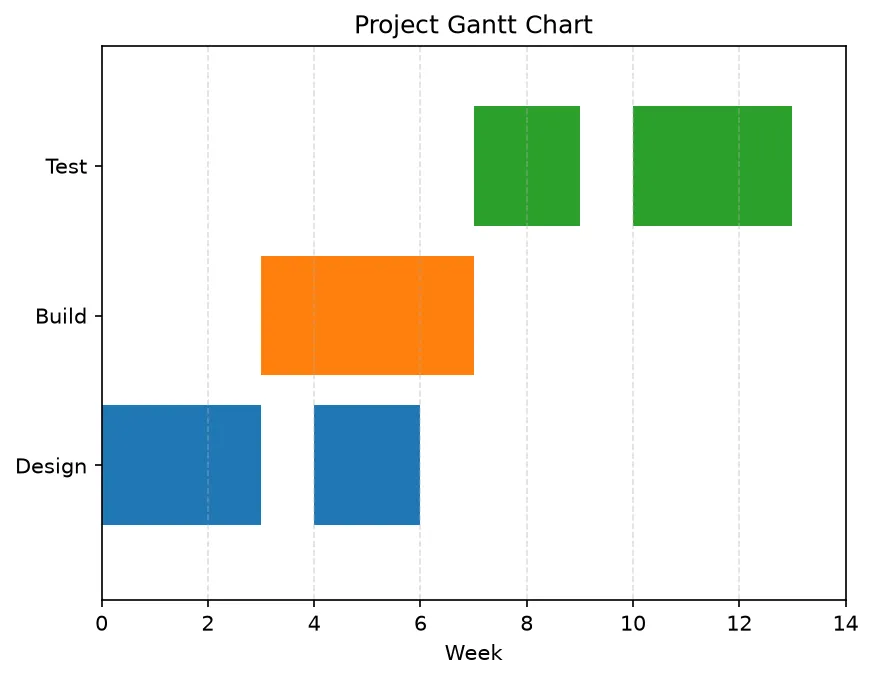
3 stairs & Precomputed Boxplots
ax.stairs(values, edges) draws a step outline — the natural partner for np.histogram, which returns counts and bin edges. And when you only have summary statistics, ax.bxp() renders a boxplot from a list of stat dictionaries instead of raw data.
import matplotlib.pyplot as plt
import numpy as np

rng = np.random.default_rng(0)
data = rng.normal(0, 1, 1000)

# Bin the data ourselves, then draw the outline
counts, edges = np.histogram(data, bins=20)

fig, (ax1, ax2) = plt.subplots(1, 2, figsize=(10, 4))

# Left: a filled histogram outline via stairs
ax1.stairs(counts, edges, fill=True, color="slateblue", alpha=0.7)
ax1.set_title("Histogram via stairs()")

# Right: a boxplot from PRECOMPUTED stats with bxp
stats = [{
    "label": "A", "med": 5, "q1": 3, "q3": 7,
    "whislo": 1, "whishi": 9, "fliers": [],
}, {
    "label": "B", "med": 6, "q1": 4.5, "q3": 8,
    "whislo": 2, "whishi": 11, "fliers": [12.5],
}]
ax2.bxp(stats, showfliers=True)
ax2.set_title("Boxplot via bxp()")

fig.tight_layout()
plt.show()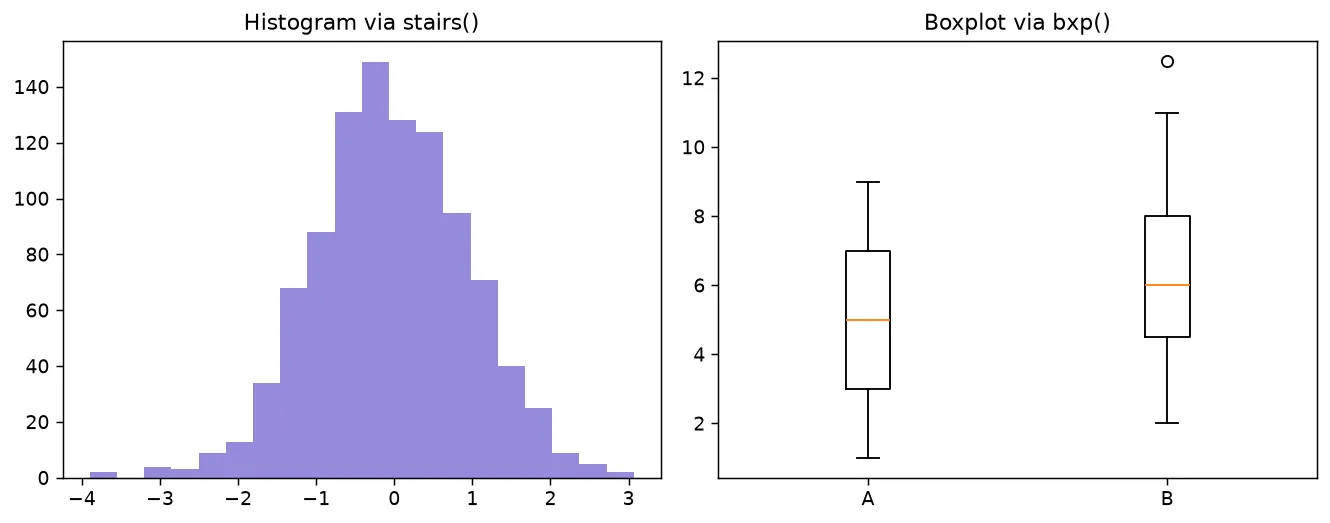
What you'll see: on the left a filled bell-shaped step outline drawn straight from the histogram counts, and on the right two boxplots built entirely from the median and quartile numbers — no raw samples required.
🎯 Your Turn: Fill in the Blanks
Replace each ___ to raster a single row of event times.
import matplotlib.pyplot as plt

# Times (in seconds) when a button was pressed
presses = [0.5, 1.2, 1.3, 3.0, 4.8, 5.1, 7.7]

fig, ax = plt.subplots()

# Draw a raster of ticks at those times
ax.___(presses, colors="darkgreen")

ax.set_xlabel("Time (s)")
ax.set_title("Button Presses")

# Display the figure
plt.___()
📋 Common Errors & Quick Reference
❌ broken_barh shows one giant bar
You passed an end point as the width. ✅ The tuple is (start, duration) — use the length, not the end coordinate.
❌ stairs: len(values) must equal len(edges) - 1
There is always one more edge than value. ✅ Use the counts, edges straight from np.histogram without trimming.
Each stats dict needs med, q1, q3, whislo, whishi. ✅ Supply all required keys (and fliers as a list).
| Call | Best For |
|---|---|
| ax.eventplot(data) | Timelines / spike rasters |
| ax.broken_barh(ranges, yr) | Gantt-style schedules |
| ax.stairs(values, edges) | Histogram / step outlines |
| ax.bxp(stats) | Boxplots from precomputed stats |
🎯 Mini-Challenge: A Two-Task Schedule
Use broken_barh to chart two tasks, each with a gap, on their own rows.
import matplotlib.pyplot as plt

fig, ax = plt.subplots()

# Task 1 works days 0-2 and 5-7
ax.broken_barh([(0, 2), (5, 2)], (10, 6), facecolors="tab:purple")

# Task 2 works days 2-4 and 8-9
ax.broken_barh([(2, 2), (8, 1)], (20, 6), facecolors="tab:red")

ax.set_ylim(5, 30)
ax.set_xlim(0, 10)
ax.set_yticks([13, 23])
ax.set_yticklabels(["Task 1", "Task 2"])
ax.set_xlabel("Day")
ax.set_title("Two-Task Schedule")

plt.show()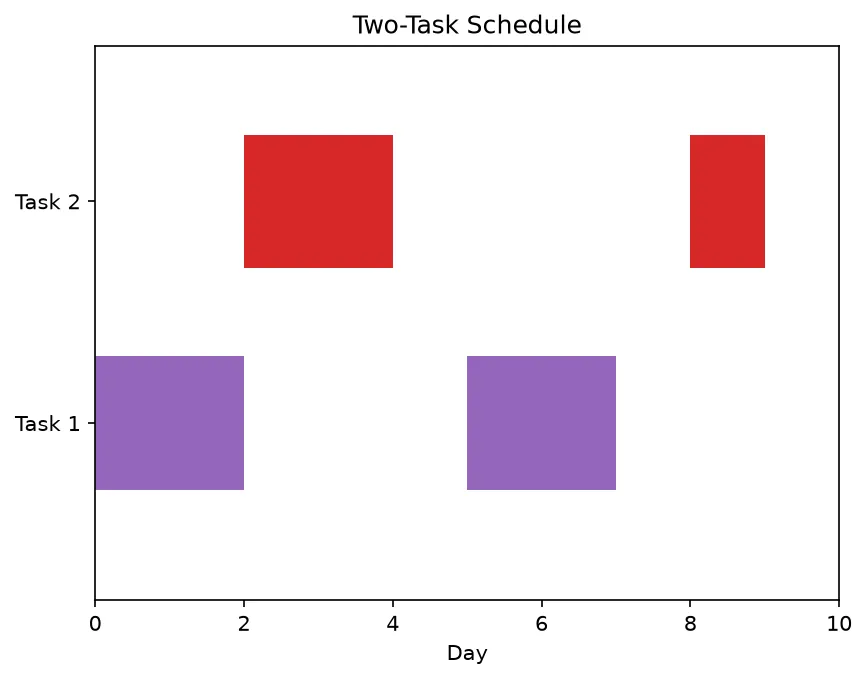
import matplotlib.pyplot as plt

fig, axes = plt.subplots(1, 3, figsize=(10, 3))

axes[0].stem([1, 2, 3, 4], [3, 1, 4, 2])
axes[1].step([1, 2, 3, 4], [3, 1, 4, 2], where="mid")
axes[2].barh(["a", "b", "c"], [5, 3, 8])

print("Panels:", len(fig.axes))
print("Stem containers:", len(axes[0].containers))
print("Step is drawn as a line:", len(axes[1].lines))
print("Horizontal bars:", len(axes[2].patches))
print("Longest bar:", max(p.get_width() for p in axes[2].patches))
print("Step style:", axes[1].lines[0].get_drawstyle())

# ✅ Expected output:
# Panels: 3
# Stem containers: 1
# Step is drawn as a line: 1
# Horizontal bars: 3
# Longest bar: 8
# Step style: steps-mid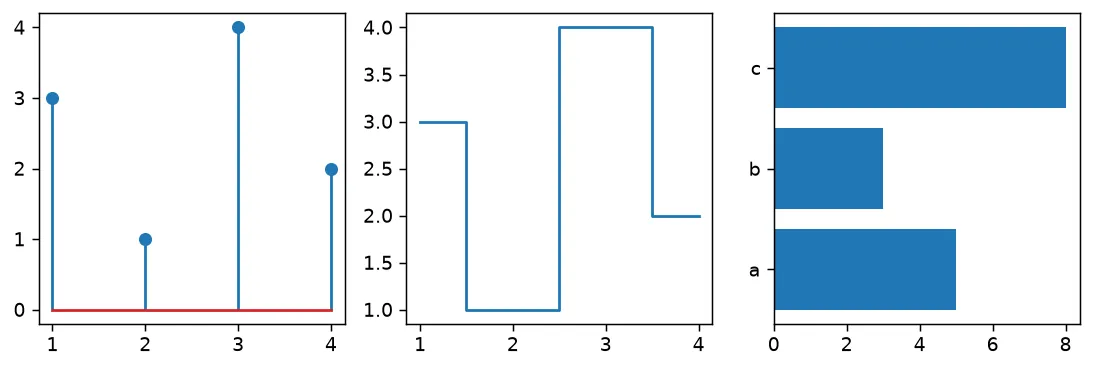
❓ Frequently Asked Questions
Lesson complete — your plotting toolbox grew!
You rastered timelines with eventplot, built Gantt rows with broken_barh, drew step outlines with stairs, and rendered boxplots from precomputed stats with bxp.
Practice quiz
What does ax.eventplot() draw?
- A filled area
- A raster of tick marks at given positions
- A pie chart
- A 3D surface
Answer: A raster of tick marks at given positions. eventplot draws a tick at every position, forming a raster like a spike train or timeline.
How do you make eventplot show several stacked rows?
- Call it many times
- Pass rows=3
- Use stack=True
- Pass a list of arrays, one per row
Answer: Pass a list of arrays, one per row. A list of arrays gives eventplot one row of ticks per array.
What does ax.broken_barh take as its first argument?
- A list of (start, width) pairs
- A single number
- Two y-values
- A colormap
Answer: A list of (start, width) pairs. broken_barh's first argument is a list of (start, width) horizontal segments.
Why is broken_barh ideal for Gantt charts?
- It logs the axis
- It draws pies
- One call can place several segments with gaps on one row
- It auto-sorts tasks
Answer: One call can place several segments with gaps on one row. Each task occupies one row and may have disconnected active periods, which broken_barh handles in one call.
What does ax.stairs(values, edges) draw?
- A scatter plot
- A step outline, like a histogram shape
- A smooth curve
- A pie chart
Answer: A step outline, like a histogram shape. stairs draws the outline of a step function from edges and values.
Which NumPy function pairs naturally with ax.stairs()?
- np.linspace
- np.sort
- np.mean
- np.histogram
Answer: np.histogram. np.histogram returns counts and bin edges, exactly what stairs(counts, edges) needs.
What does ax.bxp() take as input?
- A list of stat dictionaries (median, quartiles, whiskers)
- Raw observations
- A colormap
- A list of images
Answer: A list of stat dictionaries (median, quartiles, whiskers). bxp renders a boxplot from precomputed statistics, not raw data.
When would you choose ax.bxp() over ax.boxplot()?
- When data has no outliers
- When you want a log axis
- When you only have precomputed stats, not raw data
- When plotting a single point
Answer: When you only have precomputed stats, not raw data. boxplot computes quartiles from raw data; bxp accepts the summary stats you already have.
What relationship must hold between values and edges in ax.stairs()?
- They must be equal length
- values can be empty
- edges must be sorted descending
- len(edges) is one more than len(values)
Answer: len(edges) is one more than len(values). There is always one more edge than value, just like histogram bins.
In a broken_barh tuple, what does the second number represent?
- The y-position
- The duration (width), not the end point
- The color
- The row height
Answer: The duration (width), not the end point. Each (start, width) tuple uses a duration as the second value, not an end coordinate.
Continue this course
- Previous: Logarithmic & Symlog Scales
- Next: Donut & Nested Pie Charts — Build donut charts and nested rings with wedge properties
- Quick reference: Matplotlib cheat sheet
Frequently asked questions
What is an eventplot used for?
ax.eventplot() draws a raster of vertical (or horizontal) tick marks at a list of positions — think spike trains in neuroscience, event timestamps, or a timeline of incidents. Pass a list of arrays and each becomes its own row of ticks, so you can compare when events happened across several series at a glance.
How is broken_barh different from a normal bar chart?
ax.broken_barh() draws horizontal bars defined by (start, width) pairs at a chosen y-position, and a single call can place several disconnected segments on one row. That makes it ideal for Gantt-style timelines where each task occupies one row and may have gaps, rather than one bar per category rising from a baseline.
What does ax.stairs() draw and how does it differ from a step plot?
ax.stairs() draws the outline of a step function from edges and values, the same shape a histogram uses. It is the modern replacement for drawstyle='steps' and pairs naturally with np.histogram output, letting you draw or fill a histogram outline without re-binning the data.
When would I use ax.bxp() instead of ax.boxplot()?
ax.boxplot() takes raw data and computes the quartiles for you. ax.bxp() takes the statistics you have already computed — median, quartiles, whiskers — as a list of dictionaries. Use bxp when the numbers come from a database or a summary table and you never had the raw observations to hand to boxplot.