Donut & Nested Pie Charts
Reviewed & published by Brayan K
A donut chart is a pie chart with its center cut out, and a nested pie stacks two or more rings, letting you show a whole-to-part breakdown with a cleaner, more modern look than a solid pie.
Part of the free Matplotlib course at LearnCodingFast — hands-on lessons with worked examples and the output they print, plus practice exercises and a quick quiz.
In this lesson you'll carve a hole with wedgeprops, label slices with autopct, set the startangle, add a legend, and stack two rings into a nested pie.
What You'll Learn in This Lesson
- Drawing a pie chart with plt.pie()
- Carving a donut hole with wedgeprops width
- Labeling slices with autopct
- Rotating slices with startangle
- Adding a legend and slice labels
- Stacking two rings into a nested pie
1 From Pie to Donut
A pie chart slices a whole into proportional wedges with plt.pie(values). To make a donut, pass wedgeprops=dict(width=0.4): the width is the ring's thickness inward from the outer edge, so a smaller width leaves a bigger hole. The empty center is a great place for a total or a label.
import matplotlib.pyplot as plt

labels = ["Rent", "Food", "Transport", "Savings"]
amounts = [1200, 600, 300, 400]

fig, ax = plt.subplots()
ax.pie(amounts, labels=labels,
       autopct="%1.1f%%",        # percentage on each slice
       startangle=90,            # first slice starts at the top
       wedgeprops=dict(width=0.4))  # carve the donut hole

# A label in the hole
ax.text(0, 0, "Budget", ha="center", va="center", fontsize=14)

ax.set_aspect("equal")
ax.set_title("Monthly Budget Donut")

plt.show()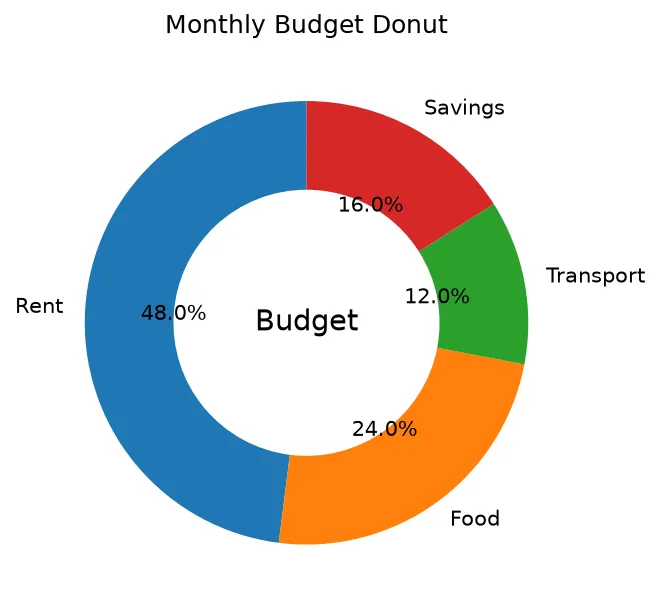
What you'll see: a ring split into four labeled slices with percentages, a hollow center holding the word "Budget", and the first slice starting cleanly at the top thanks to startangle=90.
2 Labels, Legend & Exploding a Slice
Replace cramped on-slice labels with a clean legend off to the side, pick your own colors, and pull a slice out for emphasis with the explode argument — a list of offsets, one per slice.
import matplotlib.pyplot as plt

browsers = ["Chrome", "Safari", "Edge", "Firefox", "Other"]
share = [64, 19, 5, 3, 9]
colors = ["#4285F4", "#34A853", "#0078D7", "#FF7139", "#999999"]

# Pull the biggest slice out a little
explode = [0.06, 0, 0, 0, 0]

fig, ax = plt.subplots()
wedges, _, _ = ax.pie(
    share, colors=colors, explode=explode,
    autopct="%1.0f%%", startangle=140,
    wedgeprops=dict(width=0.45, edgecolor="white"))

# A legend instead of crowded slice labels
ax.legend(wedges, browsers, title="Browser",
          loc="center left", bbox_to_anchor=(1.0, 0.5))

ax.set_aspect("equal")
ax.set_title("Browser Market Share")
fig.tight_layout()

plt.show()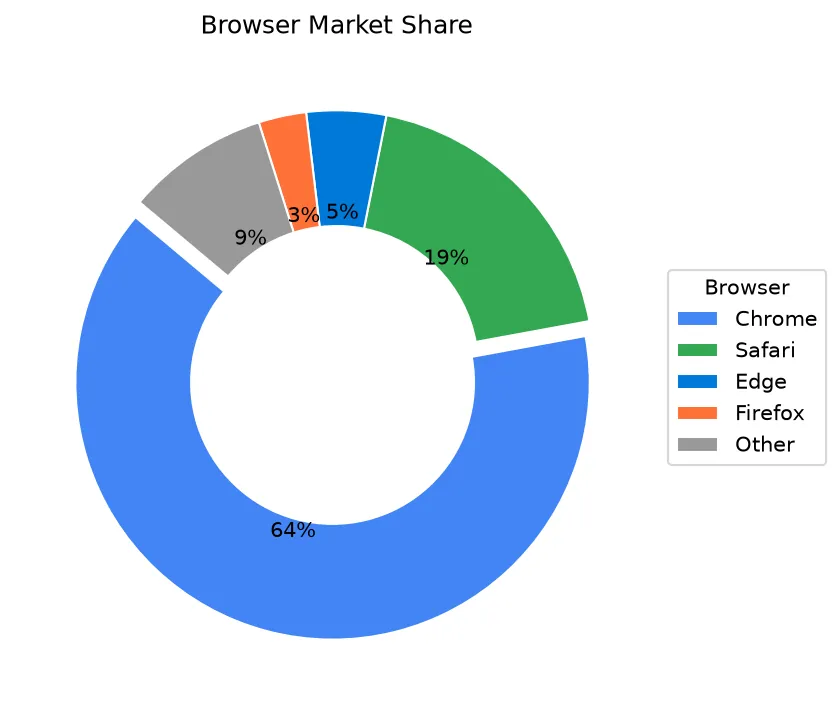
3 Nested Rings
A nested pie draws two donuts on the same axes at different radii. Plot the outer ring at radius=1, then the inner ring at a smaller radius. Order the inner values so each sub-group sits beneath its parent slice, and you get a sunburst-style whole-to-part breakdown.
import matplotlib.pyplot as plt

# Outer ring: two parent categories
outer = [60, 40]
outer_colors = ["#1f77b4", "#ff7f0e"]

# Inner ring: each parent split into two children
inner = [35, 25, 30, 10]
inner_colors = ["#aec7e8", "#9edae5", "#ffbb78", "#ffd9a0"]

fig, ax = plt.subplots()

# Outer ring at radius 1
ax.pie(outer, radius=1.0, colors=outer_colors,
       labels=["Hardware", "Software"],
       wedgeprops=dict(width=0.3, edgecolor="white"),
       startangle=90)

# Inner ring at radius 0.7
ax.pie(inner, radius=0.7, colors=inner_colors,
       wedgeprops=dict(width=0.3, edgecolor="white"),
       startangle=90)

ax.set_aspect("equal")
ax.set_title("Nested Pie: Revenue Breakdown")

plt.show()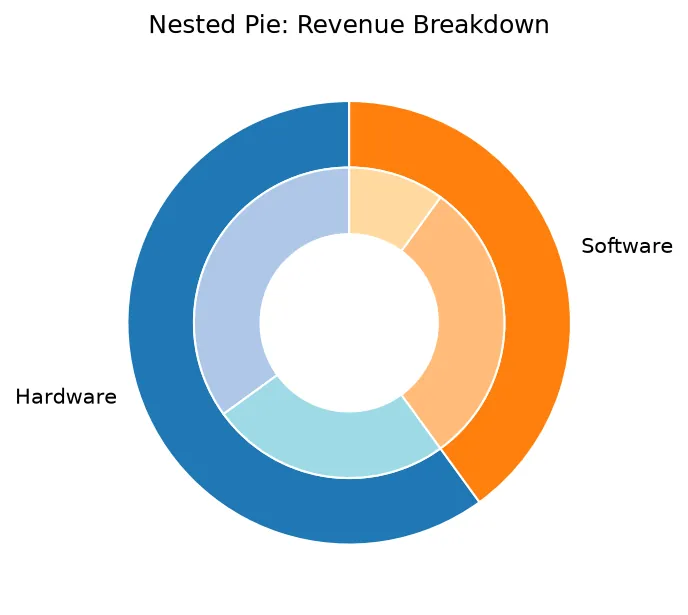
What you'll see: an outer ring of two parent categories surrounding a thinner inner ring that splits each parent into its children — a compact two-level breakdown in a single circular chart.
🎯 Your Turn: Fill in the Blanks
Replace each ___ to turn this pie into a donut with percentage labels.
import matplotlib.pyplot as plt

labels = ["Desktop", "Mobile", "Tablet"]
visits = [55, 38, 7]

fig, ax = plt.subplots()
ax.pie(visits, labels=labels,
       autopct="%1.0f%%",
       startangle=90,
       # Carve a hole 0.35 thick to make a donut
       wedgeprops=dict(width=___))

ax.set_aspect("equal")
ax.set_title("Traffic by Device")

# Display the figure
plt.___()
📋 Common Errors & Quick Reference
❌ My donut is an oval
The axes are not square. ✅ Call ax.set_aspect('equal') or plt.axis('equal').
❌ The percentages do not add to 100
pie normalizes your values to fractions of their sum. ✅ That is expected — the slices always represent shares of the total.
❌ The inner ring covers the outer one
Both rings used radius=1. ✅ Give the inner ring a smaller radius and a matching width.
| Argument | What It Does |
|---|---|
| wedgeprops=dict(width=0.4) | Carves the donut hole |
| autopct='%1.1f%%' | Labels each slice's share |
| startangle=90 | Where the first slice begins |
| explode=[...] | Pulls a slice outward |
| radius=0.7 | Sizes a ring for nesting |
🎯 Mini-Challenge: A Survey Donut
Build a donut of survey responses with custom colors, percentage labels, and the total count in the center.
import matplotlib.pyplot as plt

answers = ["Yes", "No", "Maybe"]
counts = [120, 60, 20]
colors = ["#2ca02c", "#d62728", "#7f7f7f"]

fig, ax = plt.subplots()
ax.pie(counts, labels=answers, colors=colors,
       autopct="%1.0f%%", startangle=90,
       wedgeprops=dict(width=0.4, edgecolor="white"))

# Total in the hole
total = sum(counts)
ax.text(0, 0, f"n={total}", ha="center", va="center", fontsize=16)

ax.set_aspect("equal")
ax.set_title("Survey Results")

plt.show()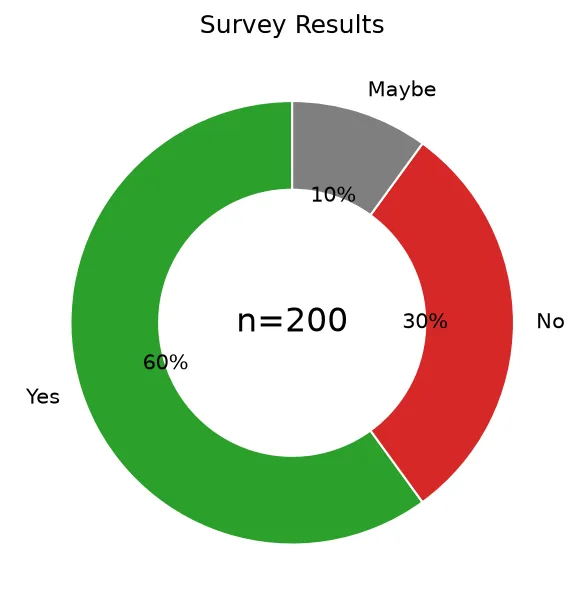
import matplotlib.pyplot as plt

labels = ["Cash", "Card", "Online"]
share = [15, 55, 30]

fig, ax = plt.subplots()
wedges, texts = ax.pie(share, labels=labels, wedgeprops=dict(width=0.4))
ax.set_aspect("equal")

print("Wedges:", len(wedges))
print("Ring width:", wedges[0].width)
print("It is a ring, not a disc:", wedges[0].width < 1.0)
print("Shares add to:", sum(share))
print("Degrees per share:", [round(s / sum(share) * 360, 1) for s in share])
print("Labels:", [t.get_text() for t in texts])

# ✅ Expected output:
# Wedges: 3
# Ring width: 0.4
# It is a ring, not a disc: True
# Shares add to: 100
# Degrees per share: [54.0, 198.0, 108.0]
# Labels: ['Cash', 'Card', 'Online']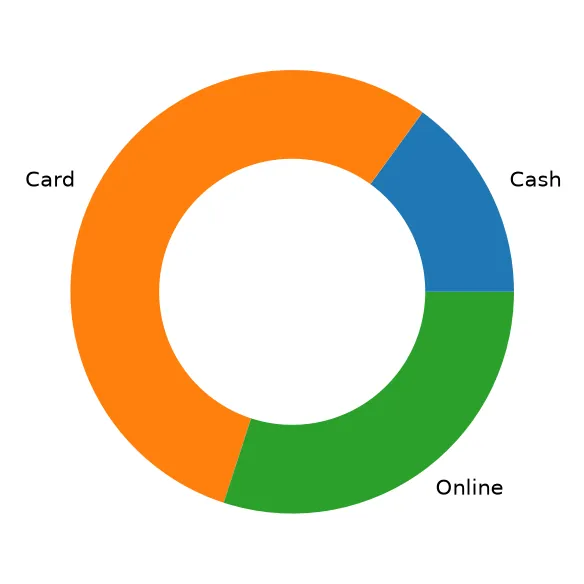
❓ Frequently Asked Questions
Lesson complete — your pies got an upgrade!
You carved donut holes with wedgeprops, labeled slices with autopct, set the start angle, exploded a slice, added a legend, and stacked two rings into a nested pie.
Practice quiz
How do you turn a pie chart into a donut?
- Pass wedgeprops=dict(width=0.4)
- Set startangle=90
- Use plt.donut()
- Pass hole=True
Answer: Pass wedgeprops=dict(width=0.4). wedgeprops with a width carves a hole, turning the pie into a donut.
In wedgeprops=dict(width=0.4), what does width measure?
- The figure width
- The ring's thickness inward from the outer edge
- The gap between slices
- The label size
Answer: The ring's thickness inward from the outer edge. width is the ring thickness measured inward from the outer radius of 1.
Which argument prints a percentage on each slice?
- labels
- explode
- autopct
- colors
Answer: autopct. autopct='%1.1f%%' formats and shows each slice's share.
What does startangle=90 do?
- Hides the first slice
- Makes the chart an oval
- Adds a legend
- Starts the first wedge at the top
Answer: Starts the first wedge at the top. startangle rotates where the first slice begins; 90 starts it at twelve o'clock.
Which argument pulls a slice outward for emphasis?
- explode
- radius
- width
- autopct
Answer: explode. explode is a list of offsets, one per slice, to pull slices out.
How many lists can ax.pie() return?
- Exactly one
- Up to three: wedges, texts, autotexts
- Exactly two
- None
Answer: Up to three: wedges, texts, autotexts. ax.pie() returns wedges, texts, and (with autopct) autotexts.
How do you keep a donut a perfect circle instead of an oval?
- Set width=1
- Use startangle=0
- Call ax.set_aspect('equal')
- Add more slices
Answer: Call ax.set_aspect('equal'). ax.set_aspect('equal') (or plt.axis('equal')) makes it circular.
How do you build a nested (two-ring) pie?
- Pass nested=True
- Use plt.pie twice with one radius
- Set autopct on both
- Draw two pies at different radii (e.g. radius=1 and radius=0.7)
Answer: Draw two pies at different radii (e.g. radius=1 and radius=0.7). Plot the outer ring at radius 1 and the inner ring at a smaller radius.
Why do a pie's percentages always sum to 100%?
- pie normalizes values to fractions of their sum
- It is a bug
- Only when autopct is set
- Because of startangle
Answer: pie normalizes values to fractions of their sum. pie normalizes the values to shares of the total, so they sum to 100%.
If the inner ring covers the outer ring, what went wrong?
- Wrong colormap
- Both rings used radius=1
- autopct was missing
- startangle was 90
Answer: Both rings used radius=1. Give the inner ring a smaller radius (and matching width) so it nests inside.
Continue this course
- Previous: More Plot Types: eventplot, broken_barh, stairs
- Next: Checkpoint: Data Visualization — Combine several advanced techniques into one polished figure — then a quiz
- Quick reference: Matplotlib cheat sheet
Frequently asked questions
How do I turn a pie chart into a donut?
Pass wedgeprops with a width to plt.pie: plt.pie(values, wedgeprops=dict(width=0.4)). The width is the thickness of the ring measured inward from the outer radius of 1, so width=0.4 leaves a hole of radius 0.6 in the middle. A smaller width gives a thinner ring and a bigger hole.
How do I add a percentage label to each slice?
Use the autopct argument, a format string applied to each slice's share: plt.pie(values, autopct='%1.1f%%') prints one decimal place followed by a percent sign. You can also pass a function to autopct for full control, for example converting the percentage back into the raw count.
What does startangle do?
startangle rotates where the first slice begins, measured in degrees counter-clockwise from the positive x-axis. startangle=90 starts the first wedge at the top, which is the convention most readers expect, so slices then proceed clockwise or counter-clockwise from twelve o'clock.
How do I make a nested (multi-level) pie?
Draw two pies on the same axes at different radii. Plot the outer ring first with radius=1 and a wedgeprops width, then plot the inner ring with a smaller radius (for example radius=0.7) and its own width. Aligning the inner categories under their outer parents creates a sunburst-style breakdown.