Markers, Line Styles & Colors
Reviewed & published by Brayan K
Matplotlib is a Python library for creating charts and visualizations — and this lesson is about styling them, so each line looks exactly the way you want.
Part of the free Matplotlib course at LearnCodingFast — hands-on lessons with worked examples and the output they print, plus practice exercises and a quick quiz.
You'll set colors, switch between solid, dashed, and dotted lines, add point markers, and learn the compact format-string shortcut like 'ro--'.
What You'll Learn in This Lesson
- Setting a line color with color=
- Choosing a line style with linestyle=
- Controlling thickness with linewidth=
- Adding point markers with marker=
- Sizing markers with markersize=
- The shorthand format string like 'ro--'
1 Colors, Styles, and Width
Three keyword arguments give you full control of a line's appearance: color, linestyle, and linewidth.
- color="red" — name, letter ('r'), or hex ('#1f77b4')
- linestyle="--" — solid '-', dashed '--', dotted ':', dash-dot '-.'
- linewidth=2.5 — thickness in points
import matplotlib.pyplot as plt

x = [1, 2, 3, 4, 5, 6]
y = [10, 14, 12, 18, 22, 20]

# A thick, dashed, green line
plt.plot(x, y, color="green", linestyle="--", linewidth=3)

plt.show()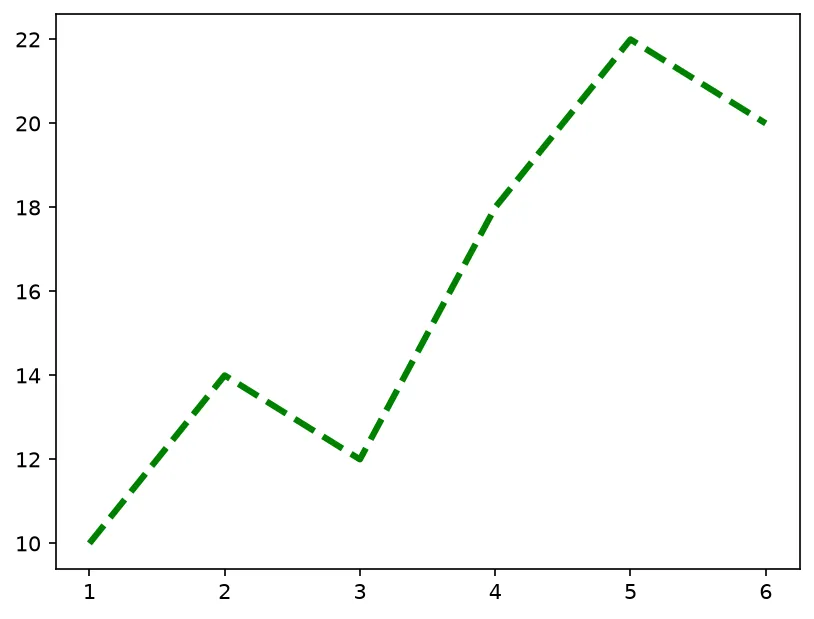
What you'll see: a single line that is clearly green, drawn as a series of dashes rather than a solid stroke, and noticeably thicker than the default.
2 Markers on the Data Points
Markers draw a shape at each data point, which is useful when you want to highlight the exact values, not just the trend. Use marker= and size them with markersize=.
import matplotlib.pyplot as plt

x = [1, 2, 3, 4, 5]
y = [3, 8, 5, 12, 9]

# Blue line with large circle markers at each point
plt.plot(x, y, color="blue", marker="o", markersize=10)

plt.show()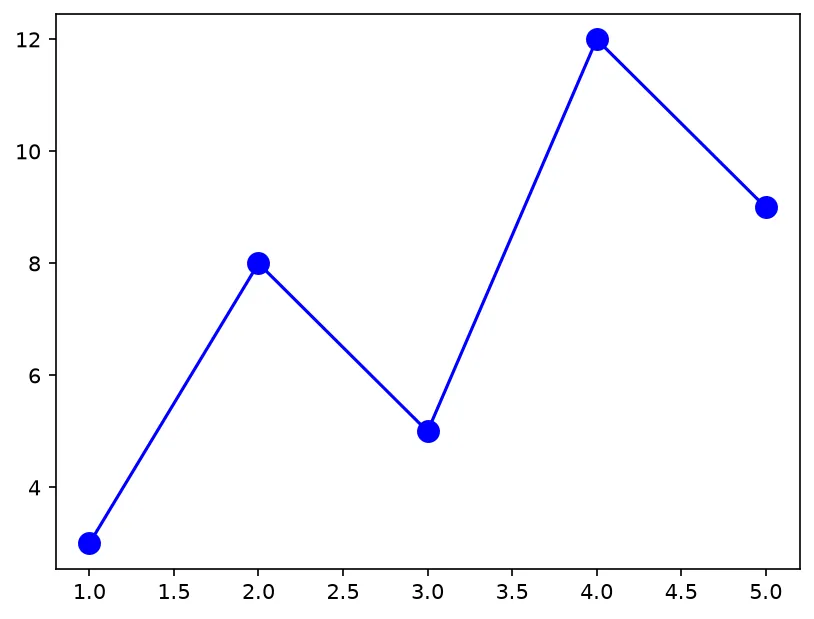
What you'll see: a blue line with a bold filled circle sitting on every data point, making each of the five measured values easy to spot.
3 The Shorthand Format String
Matplotlib accepts a compact third argument that bundles color, marker, and line style into one string. 'ro--' means red circles joined by a dashed line. The order is color, then marker, then style.
import matplotlib.pyplot as plt

x = [1, 2, 3, 4, 5]
y = [2, 5, 3, 8, 6]

# 'ro--' = red color, circle markers, dashed line
plt.plot(x, y, "ro--")

# 'g^-' = green, triangle markers, solid line
y2 = [1, 3, 2, 5, 4]
plt.plot(x, y2, "g^-")

plt.show()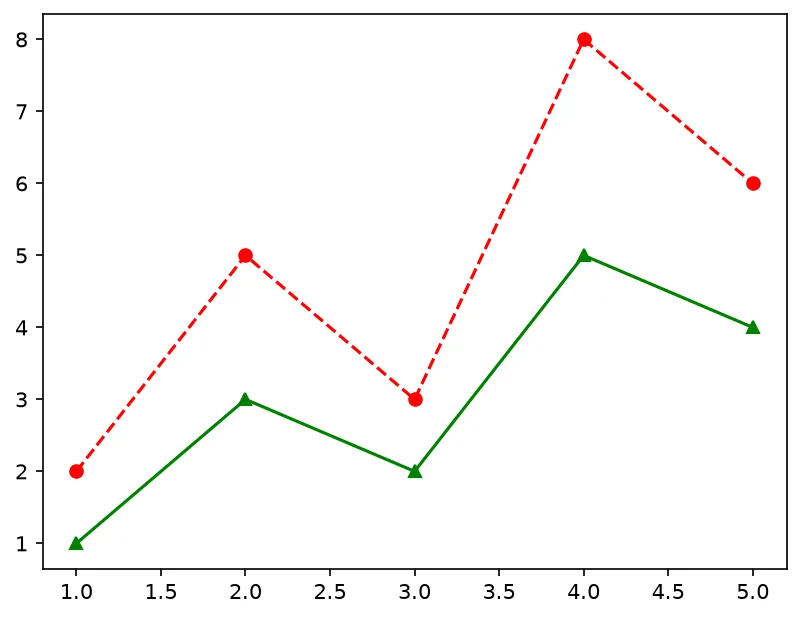
What you'll see: a red dashed line with circle markers and a green solid line with triangle markers, both fully styled from a single short string each.
🎯 Your Turn: Fill in the Blanks
Replace each ___ to style this line your way.
import matplotlib.pyplot as plt

x = [1, 2, 3, 4, 5]
y = [4, 9, 7, 14, 11]

plt.plot(
    x, y,
    color="___",        # try "purple"
    linestyle="___",    # try "--" for dashed
    marker="o",
    markersize=___      # try 8
)

plt.show()
📋 Common Errors & Quick Reference
❌ ValueError: Unrecognized character / invalid format string
Your format string uses letters Matplotlib doesn't know. Stick to valid color, marker, and style codes like 'ro--'.
❌ My markers don't appear
You set linestyle but no marker. Add marker="o" to show points.
| Code | Meaning |
|---|---|
| color="red" | Line color (name/letter/hex) |
| linestyle="--" | Dashed line ('-', ':', '-.') |
| marker="o" | Circle markers ('s', '^', '*') |
| linewidth=2 | Line thickness in points |
| "ro--" | Red, circles, dashed (shorthand) |
🏆 Mini Challenge: Two Styled Lines
Plot two lines with contrasting colors, styles, and markers.
import matplotlib.pyplot as plt

x = [1, 2, 3, 4, 5, 6]
plan = [10, 20, 30, 40, 50, 60]
actual = [8, 19, 27, 35, 48, 55]

# 1. Plan: blue dashed line with square markers
plt.plot(x, plan, color="blue", linestyle="--", marker="s", label="Plan")

# 2. Actual: red solid line with circle markers
plt.plot(x, actual, color="red", linestyle="-", marker="o", label="Actual")

plt.legend()
plt.show()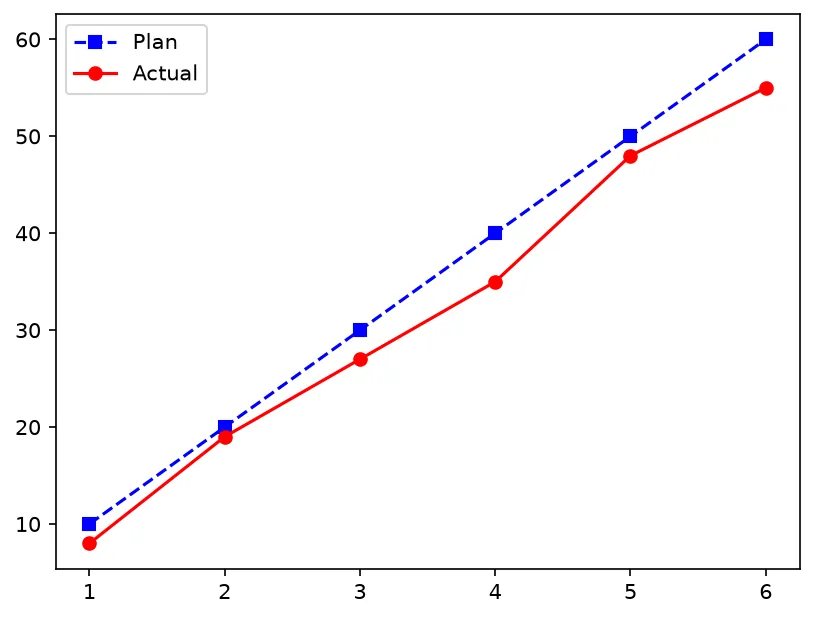
import matplotlib.pyplot as plt
from matplotlib.colors import to_hex

fig, ax = plt.subplots()
ax.plot([1, 2, 3], [1, 3, 2], color="#d62728", linewidth=3, linestyle=":", marker="s", markersize=8, alpha=0.8)

line = ax.lines[0]
print("Colour:     ", to_hex(line.get_color()))
print("Width:      ", line.get_linewidth())
print("Style:      ", line.get_linestyle())
print("Marker:     ", line.get_marker())
print("Marker size:", line.get_markersize())
print("Alpha:      ", line.get_alpha())

# ✅ Expected output:
# Colour:      #d62728
# Width:       3.0
# Style:       :
# Marker:      s
# Marker size: 8.0
# Alpha:       0.8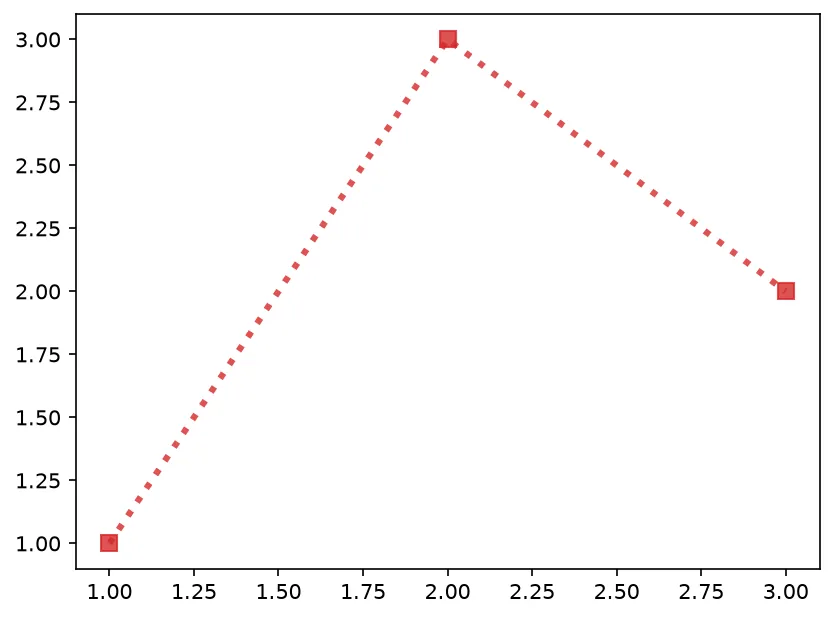
❓ Frequently Asked Questions
Lesson complete — you control the look!
You set colors, line styles, widths, and markers, and learned the compact format-string shortcut.
Practice quiz
Which argument sets a line's color?
- tint=
- color=
- shade=
- hue=
Answer: color=. Pass color= a name, single-letter code, or hex string.
Which linestyle value gives a dashed line?
- '--'
- ':'
- '-'
- '-.'
Answer: '--'. linestyle='--' is dashed; ':' is dotted, '-' solid, '-.' dash-dot.
Which hex string is a valid color?
- '1f77b4'
- '#1f77b4'
- '0x1f77b4'
- 'rgb(31,119,180)'
Answer: '#1f77b4'. Matplotlib hex colors start with #, like '#1f77b4'.
What does the format string 'ro--' mean?
- Red dotted line, no markers
- Orange squares, solid line
- Round line, orange dashes
- Red circle markers, dashed line
Answer: Red circle markers, dashed line. 'ro--' is color red, circle markers, dashed line — color, marker, then style.
Which argument adds point markers?
- marker=
- point=
- dot=
- symbol=
Answer: marker=. marker='o' draws circles; 's', '^', '*' are other shapes.
Which argument controls line thickness?
- thickness=
- weight=
- linewidth=
- bold=
Answer: linewidth=. linewidth= sets the line thickness in points.
Which marker value draws squares?
- '^'
- 's'
- '*'
- 'o'
Answer: 's'. marker='s' draws squares; '^' is a triangle, '*' a star, 'o' a circle.
What is the order of parts in a format string like 'g^-'?
- color, marker, line style
- marker, color, line style
- line style, color, marker
- color, line style, marker
Answer: color, marker, line style. The order is color, then marker, then line style.
Why might markers not appear?
- linewidth is too high
- color was a hex string
- No marker= was set
- linestyle was solid
Answer: No marker= was set. Without a marker= argument no point markers are drawn.
Which linestyle value is dotted?
- '--'
- '-.'
- '-'
- ':'
Answer: ':'. linestyle=':' draws a dotted line.
Continue this course
- Previous: Labels, Titles & Legends
- Next: Saving Figures — Export charts to PNG, SVG, and PDF with savefig and the right DPI
- Quick reference: Matplotlib cheat sheet › Styling
Frequently asked questions
How do I change a line's color?
Pass color= to plt.plot(), such as color='red' or a hex code like color='#1f77b4'. You can use named colors, single-letter codes like 'r' and 'g', or hex strings.
How do I make a dashed line?
Use the linestyle argument: linestyle='--' for dashed, ':' for dotted, '-.' for dash-dot, and '-' (the default) for solid.
What is the shorthand format string?
It is a compact third positional argument that combines color, marker, and line style, like 'ro--' meaning red circles joined by a dashed line. The order is color, marker, then line style.
How do I add point markers?
Pass marker='o' for circles, 's' for squares, '^' for triangles, and so on. Control their size with markersize, for example marker='o', markersize=8.