Saving Figures
Reviewed & published by Brayan K
Matplotlib is a Python library for creating charts and visualizations — and once a chart looks right, you'll want it as a file you can drop into a report, email, or web page.
Part of the free Matplotlib course at LearnCodingFast — hands-on lessons with worked examples and the output they print, plus practice exercises and a quick quiz.
In this lesson you'll use plt.savefig() to export charts as PNG, SVG, and PDF, and tune resolution, bounds, and transparency.
What You'll Learn in This Lesson
- Saving a chart with plt.savefig()
- Choosing formats by file extension
- Setting resolution with dpi=
- Trimming edges with bbox_inches='tight'
- Making a transparent background
- Why savefig must come before show()
1 Saving with savefig
plt.savefig("name.png") writes the current figure to a file. The extension you choose decides the format — no extra settings needed.
- .png — sharp raster image, great for the web
- .jpg — smaller raster, good for photos
- .svg — vector, scales without blurring
- .pdf — vector, perfect for print and documents
import matplotlib.pyplot as plt

x = [1, 2, 3, 4, 5]
y = [2, 5, 4, 8, 7]

plt.plot(x, y)
plt.title("My Chart")

# Save BEFORE showing
plt.savefig("my_chart.png")

plt.show()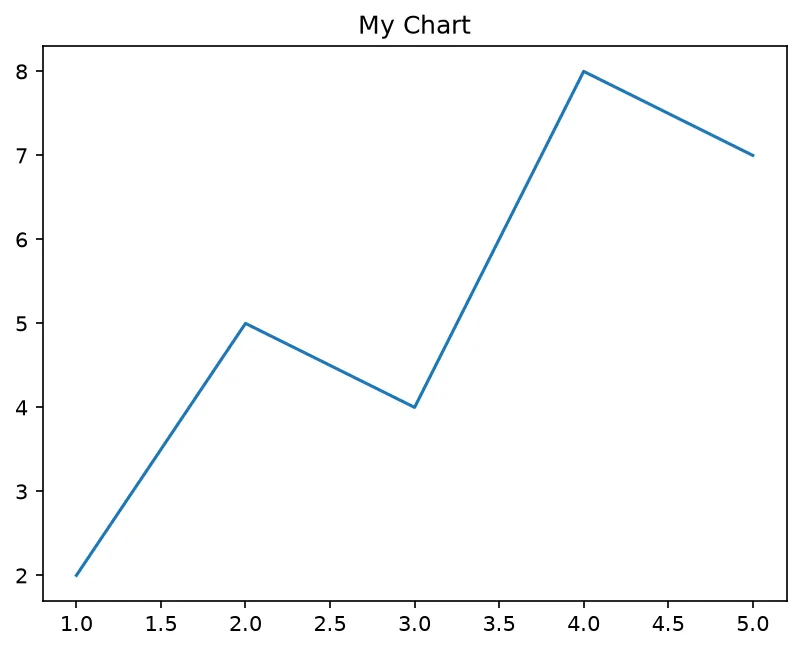
What you'll see: a normal line chart on screen, and a new file my_chart.png in your working folder that contains the exact same image — open it and the chart is there.
2 Resolution and Tight Bounds
Two arguments make saved charts look professional: dpi raises the resolution, and bbox_inches="tight" trims any wasted whitespace around the plot so labels aren't cut off.
import matplotlib.pyplot as plt

x = [1, 2, 3, 4, 5, 6]
y = [10, 13, 12, 17, 21, 19]

plt.plot(x, y)
plt.xlabel("Day")
plt.ylabel("Visitors")
plt.title("Daily Visitors")

# High resolution, trimmed neatly to fit the labels
plt.savefig("visitors.png", dpi=300, bbox_inches="tight")

plt.show()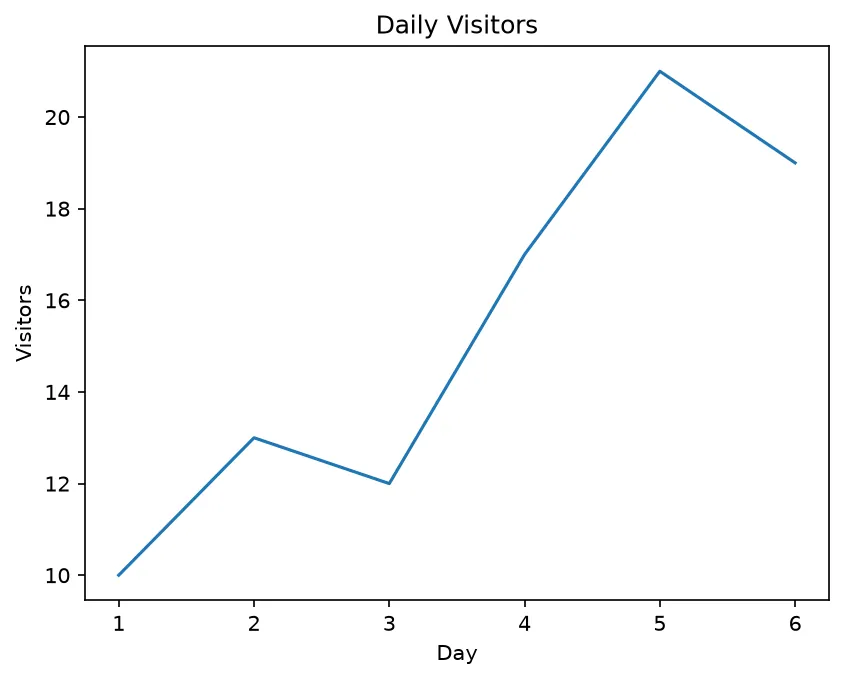
What you'll see: the same on-screen chart, but the saved visitors.png is much higher resolution and cropped snugly around the plot and its labels, with no extra border.
3 Transparency and Vector Formats
Pass transparent=True to drop the white background — handy for slides and web pages. Save with a .svg or .pdf extension to get crisp vector output that scales to any size.
import matplotlib.pyplot as plt

x = [1, 2, 3, 4, 5]
y = [5, 9, 7, 12, 10]

plt.plot(x, y, color="purple")
plt.title("Vector Export")

# PNG with a see-through background
plt.savefig("chart_transparent.png", transparent=True)

# Vector formats: pick the format by extension
plt.savefig("chart.svg")
plt.savefig("chart.pdf")

plt.show()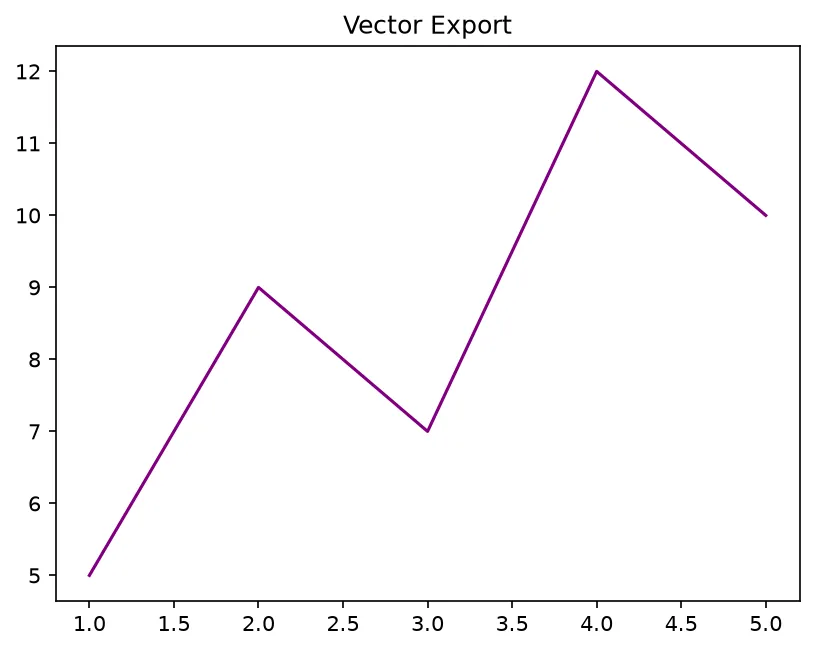
What you'll see: the purple chart on screen, plus three files — a PNG whose background is see-through, and SVG and PDF versions that stay razor-sharp no matter how far you zoom in.
🎯 Your Turn: Fill in the Blanks
Replace each ___ to save a high-resolution, neatly trimmed chart.
import matplotlib.pyplot as plt

x = [1, 2, 3, 4]
y = [3, 6, 5, 9]

plt.plot(x, y)
plt.title("Saved Chart")

# Save as a PNG at 300 dpi, trimmed tightly
plt.___("report.png", dpi=___, bbox_inches="___")

# Then display it
plt.___()
📋 Common Errors & Quick Reference
❌ Saved file is blank / empty
You called savefig() after show(). The figure was already cleared. Save first.
❌ Labels are cut off in the image
Add bbox_inches="tight" so Matplotlib expands the bounds to include every label.
| Call | What It Does |
|---|---|
| plt.savefig("a.png") | Save (format from extension) |
| dpi=300 | High resolution for print |
| bbox_inches="tight" | Trim surrounding whitespace |
| transparent=True | See-through background (PNG/SVG) |
| "chart.svg" / ".pdf" | Crisp vector output |
🏆 Mini Challenge: Export-Ready Report Chart
Build a labelled chart and export it twice — a print PNG and a vector PDF.
import matplotlib.pyplot as plt

quarter = [1, 2, 3, 4]
profit = [12, 18, 15, 24]

plt.plot(quarter, profit, marker="o")
plt.xlabel("Quarter")
plt.ylabel("Profit ($k)")
plt.title("Quarterly Profit")

# 1. High-res PNG, trimmed tight
plt.savefig("profit.png", dpi=300, bbox_inches="tight")

# 2. Vector PDF for the printed report
plt.savefig("profit.pdf", bbox_inches="tight")

# 3. Show it on screen
plt.show()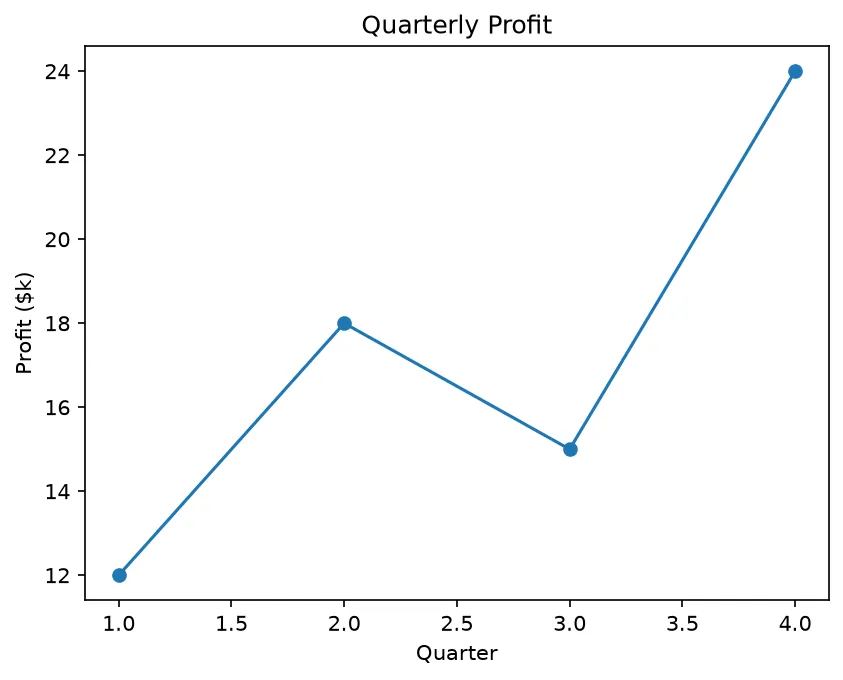
import os
import matplotlib.pyplot as plt

fig, ax = plt.subplots(figsize=(4, 3), dpi=100)
ax.plot([1, 2, 3], [1, 4, 9])

fig.savefig("chart.png", dpi=100, bbox_inches="tight")
fig.savefig("chart.svg")

png_head = open("chart.png", "rb").read(8)
svg_head = open("chart.svg", "r", encoding="utf8").read(5)

print("PNG written:", os.path.exists("chart.png"))
print("SVG written:", os.path.exists("chart.svg"))
print("PNG magic bytes:", list(png_head[:4]))
print("SVG starts as XML:", svg_head.startswith("<?xml"))
print("Figure size in inches:", fig.get_size_inches().tolist())
print("At 100 dpi that is:", [int(v * 100) for v in fig.get_size_inches()], "pixels before bbox trimming")

os.remove("chart.png")
os.remove("chart.svg")

# ✅ Expected output:
# PNG written: True
# SVG written: True
# PNG magic bytes: [137, 80, 78, 71]
# SVG starts as XML: True
# Figure size in inches: [4.0, 3.0]
# At 100 dpi that is: [400, 300] pixels before bbox trimming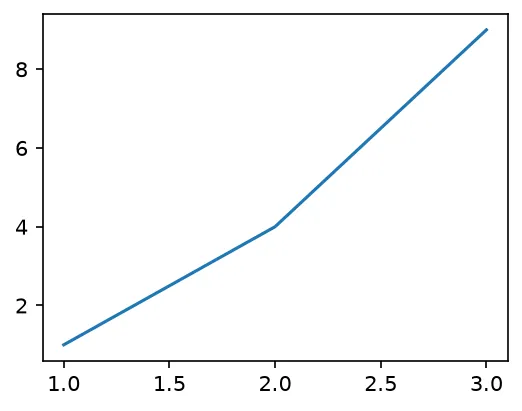
❓ Frequently Asked Questions
Lesson complete — your charts are export-ready!
You saved figures as PNG, SVG, and PDF, tuned resolution with dpi, trimmed bounds, and added transparency.
Practice quiz
Which call writes the current figure to a file?
- plt.export()
- plt.write()
- plt.savefig('chart.png')
- plt.dump()
Answer: plt.savefig('chart.png'). plt.savefig('chart.png') saves the current figure to disk.
How does savefig decide the file format?
- From the file extension
- From a format=auto flag
- It always saves PNG
- From the dpi value
Answer: From the file extension. The extension (.png, .svg, .pdf) selects the output format.
What does the dpi argument control?
- The figure title
- The resolution of raster output
- The background color
- The line style
Answer: The resolution of raster output. dpi (dots per inch) sets the resolution; dpi=300 is common for print.
Which argument trims whitespace so labels are not cut off?
- pad='none'
- trim=True
- crop='auto'
- bbox_inches='tight'
Answer: bbox_inches='tight'. bbox_inches='tight' crops the image snugly around the plot and labels.
How do you save with a see-through background?
- transparent=True
- background=None
- alpha=0
- clear=True
Answer: transparent=True. Pass transparent=True to drop the white background (PNG/SVG).
Why must savefig come before show()?
- show() runs faster afterward
- show() clears the figure, leaving a blank save
- savefig needs the window open
- Order does not matter
Answer: show() clears the figure, leaving a blank save. After show() the figure is cleared, so a later savefig writes a blank image.
Which extensions give crisp vector output?
- .jpg and .gif
- .png and .bmp
- .svg and .pdf
- .tif and .jpg
Answer: .svg and .pdf. .svg and .pdf are vector formats that scale without blurring.
Which format ignores transparent=True?
- PNG
- SVG
- JPG
Answer: JPG. JPEG has no alpha channel, so transparent=True is ignored for JPG.
What dpi value is the usual standard for print?
- 72
- 100
- 300
- 10
Answer: 300. dpi=300 is the usual print standard; default 100 is fine for the web.
Why might a saved file appear blank or empty?
- dpi was too high
- The extension was .png
- savefig was called after show()
- bbox_inches was used
Answer: savefig was called after show(). Calling savefig after show() saves an already-cleared figure.
Continue this course
- Previous: Markers, Line Styles & Colors
- Next: Bar Charts — Compare categories with vertical, horizontal, and grouped bars
- Quick reference: Matplotlib cheat sheet › Saving
Frequently asked questions
How do I save a chart to a file?
Call plt.savefig('chart.png') before plt.show(). Matplotlib writes the current figure to disk in your working directory using the file extension to pick the format.
Which file formats can Matplotlib save?
It chooses the format from the file extension. Common ones are .png and .jpg for raster images, and .svg and .pdf for crisp vector graphics that scale without blurring.
What does dpi do?
dpi (dots per inch) controls the resolution of raster images like PNG. A higher value such as dpi=300 produces a sharper, larger file suitable for printing.
Why is part of my chart cut off in the saved file?
Labels can spill outside the default bounding box. Pass bbox_inches='tight' to savefig so Matplotlib trims the image to fit everything neatly.