Bar Charts
Reviewed & published by Brayan K
Matplotlib is a Python library for creating charts and visualizations — and the bar chart is its workhorse for comparing discrete categories like products, regions, or months at a glance.
Part of the free Matplotlib course at LearnCodingFast — hands-on lessons with worked examples and the output they print, plus practice exercises and a quick quiz.
In this lesson you'll build vertical and horizontal bars, color them, group them side by side, and label each bar with its value.
What You'll Learn in This Lesson
- Drawing vertical bars with plt.bar()
- Drawing horizontal bars with plt.barh()
- Coloring individual bars with the color argument
- Building grouped bars with numpy arange and offsets
- Adding value labels on top of each bar
- When a bar chart is the right choice
1 Your First Bar Chart
A bar chart compares values across categories. Pass two lists to plt.bar(): the category labels and their values. Matplotlib draws one rectangle per category, with height equal to the value.
import matplotlib.pyplot as plt

# Categories and the value for each one
fruits = ["Apples", "Bananas", "Cherries", "Dates"]
sold = [42, 58, 31, 25]

# Draw one bar per category
plt.bar(fruits, sold, color="steelblue")

plt.title("Fruit Sold This Week")
plt.xlabel("Fruit")
plt.ylabel("Units Sold")

plt.show()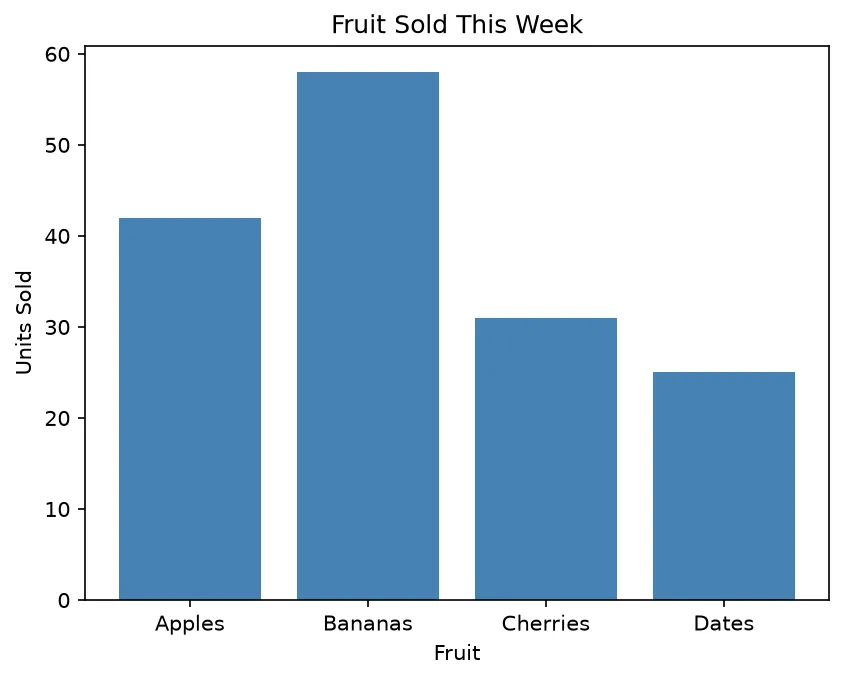
What you'll see: four steel-blue bars side by side. Bananas is the tallest at 58, Dates is the shortest at 25, and the fruit names sit neatly along the x-axis with a title above the chart.
2 Horizontal Bars & Per-Bar Colors
When category names are long, horizontal bars read better. Swap plt.bar() for plt.barh(). You can also pass a list of colors to highlight individual bars.
import matplotlib.pyplot as plt

languages = ["Python", "JavaScript", "C++", "Go", "Rust"]
popularity = [88, 75, 52, 40, 35]

# Horizontal bars, each a different color
colors = ["#3776AB", "#F7DF1E", "#00599C", "#00ADD8", "#DEA584"]
plt.barh(languages, popularity, color=colors)

plt.title("Language Popularity Score")
plt.xlabel("Score")

plt.show()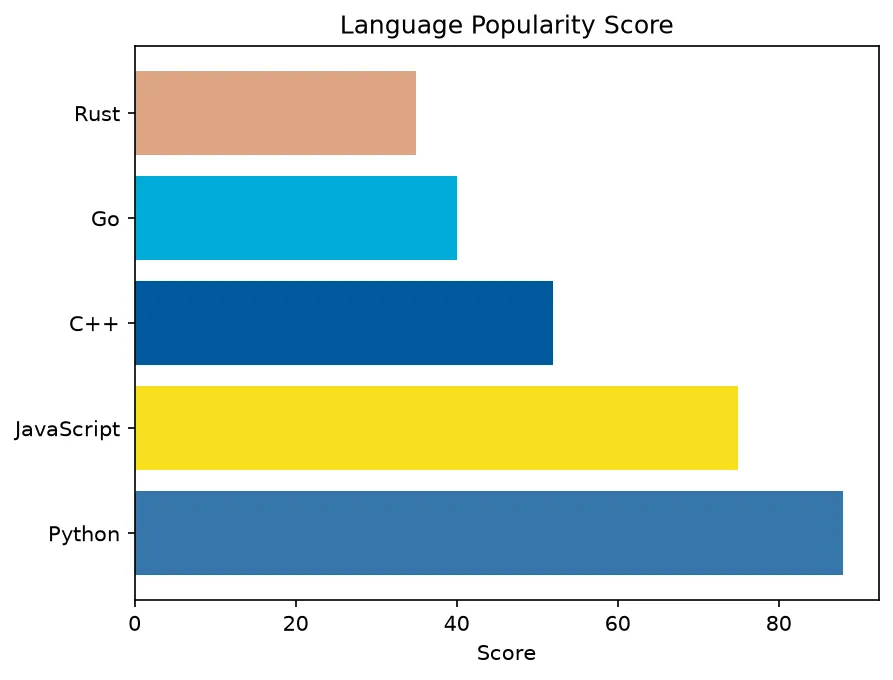
What you'll see: five horizontal bars stacked from bottom to top, each in its own color. Python's bar stretches furthest to the right at 88, and the long language names sit comfortably on the y-axis where they have room to breathe.
3 Grouped Bars & Value Labels
To compare two series across the same categories, draw grouped bars. Build a numeric position array with np.arange(), then shift one series left and the other right by half the bar width. A small loop adds the value above each bar.
import matplotlib.pyplot as plt
import numpy as np

quarters = ["Q1", "Q2", "Q3", "Q4"]
year_2023 = [120, 150, 130, 170]
year_2024 = [140, 160, 155, 190]

x = np.arange(len(quarters))  # positions 0, 1, 2, 3
width = 0.35                   # width of each bar

bars1 = plt.bar(x - width/2, year_2023, width, label="2023")
bars2 = plt.bar(x + width/2, year_2024, width, label="2024")

# Put the category labels under each pair
plt.xticks(x, quarters)

# Add the value on top of every bar
for bar in list(bars1) + list(bars2):
    height = bar.get_height()
    plt.text(bar.get_x() + bar.get_width()/2, height + 2,
             str(height), ha="center")

plt.title("Quarterly Revenue: 2023 vs 2024")
plt.ylabel("Revenue (k)")
plt.legend()

plt.show()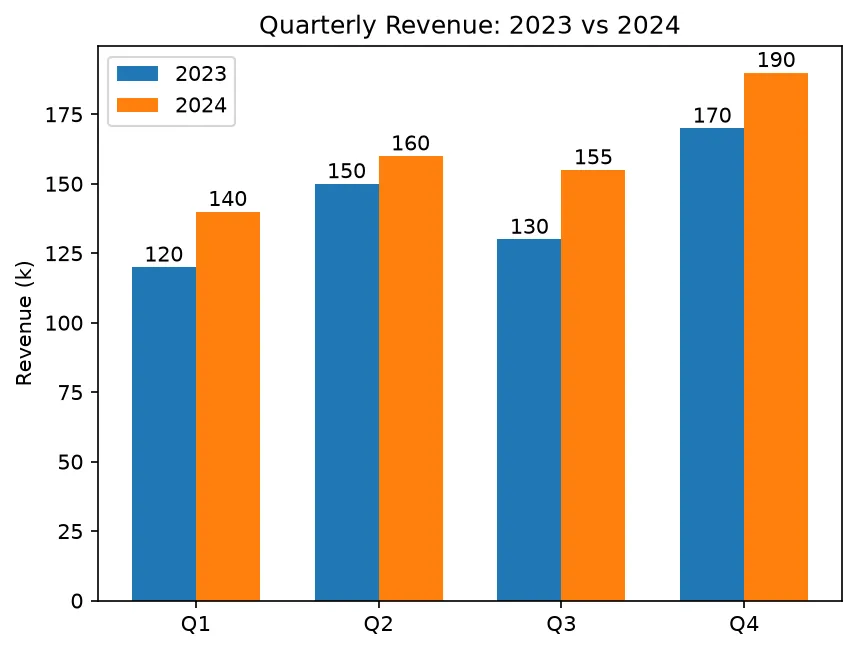
What you'll see: four pairs of bars, one pair per quarter. The 2023 bar sits just left of center and 2024 just right, the legend distinguishes the two years by color, and a small number floats above every bar showing its exact value.
🎯 Your Turn: Fill in the Blanks
Replace each ___ to build a colored bar chart and label its axes.
import matplotlib.pyplot as plt

cities = ["Tokyo", "Delhi", "Lagos"]
population = [37, 32, 15]

# Draw the bars in green
plt.___(cities, population, color="seagreen")

# Label the y-axis
plt.___("Population (millions)")

# Display the chart
plt.___()
📋 Common Errors & Quick Reference
Your category list and value list have different lengths. Every category needs exactly one value.
❌ Grouped bars overlap each other
You forgot to offset the positions. Use x - width/2 and x + width/2 with a width below 0.5.
| Call | What It Does |
|---|---|
| plt.bar(cats, vals) | Vertical bars |
| plt.barh(cats, vals) | Horizontal bars |
| color=[...] | One color per bar |
| plt.xticks(x, labels) | Set category labels at positions |
🏆 Mini Challenge: Coffee Sales
Plot how many cups of each drink were sold, then add a value above every bar.
import matplotlib.pyplot as plt

drinks = ["Latte", "Espresso", "Mocha", "Tea"]
cups = [90, 65, 45, 30]

bars = plt.bar(drinks, cups, color="saddlebrown")

# Add the count on top of each bar
for bar in bars:
    h = bar.get_height()
    plt.text(bar.get_x() + bar.get_width()/2, h + 1,
             str(h), ha="center")

plt.title("Cups Sold Today")
plt.ylabel("Cups")

plt.show()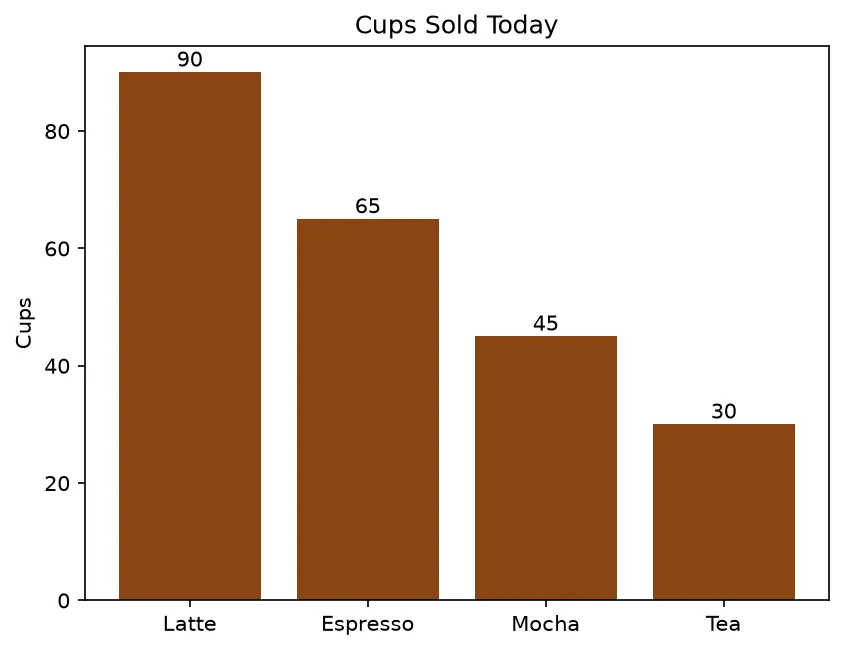
import matplotlib.pyplot as plt
from matplotlib.colors import to_hex

fruits = ["Apples", "Bananas", "Cherries", "Dates"]
sold = [42, 58, 31, 25]

fig, ax = plt.subplots()
bars = ax.bar(fruits, sold, color="steelblue")
ax.set_title("Fruit Sold This Week")
ax.set_ylabel("Units Sold")
ax.bar_label(bars, padding=2)

print("Bars drawn:", len(bars))
print("Heights:   ", [int(b.get_height()) for b in bars])
print("Tallest:   ", fruits[sold.index(max(sold))])
print("Labels on the bars:", [t.get_text() for t in ax.texts])
print("Bar colour:", to_hex(bars[0].get_facecolor()))
print("Top of the y axis clears the tallest bar:", ax.get_ylim()[1] > max(sold))

# ✅ Expected output:
# Bars drawn: 4
# Heights:    [42, 58, 31, 25]
# Tallest:    Bananas
# Labels on the bars: ['42', '58', '31', '25']
# Bar colour: #4682b4
# Top of the y axis clears the tallest bar: True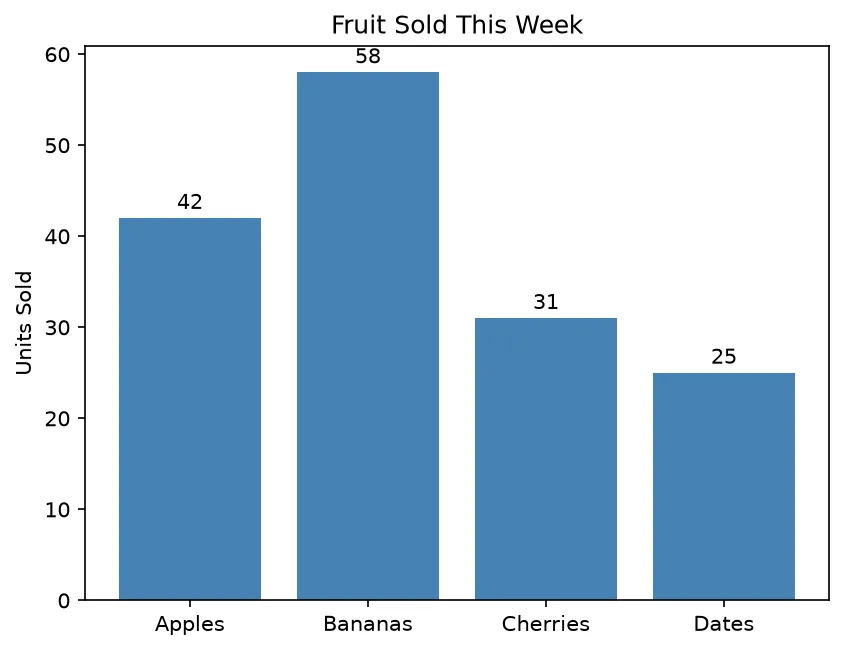
❓ Frequently Asked Questions
Lesson complete — you can compare categories with bars!
You drew vertical and horizontal bars, colored them individually, grouped two series side by side, and labeled each bar with its value.
Practice quiz
Which function draws vertical bars?
- plt.barh()
- plt.bar()
- plt.hist()
- plt.scatter()
Answer: plt.bar(). plt.bar() draws vertical bars with the value as the height.
Which function draws horizontal bars?
- plt.barh()
- plt.bar()
- plt.plot()
- plt.pie()
Answer: plt.barh(). plt.barh() draws horizontal bars, handy for long category labels.
In a vertical bar chart, what does each bar's height represent?
- The category name
- The number of bars
- The value for that category
- The bar width
Answer: The value for that category. With plt.bar() the height equals the value for that category.
How do you give each bar its own color?
- Use plt.barh() only
- Set marker per bar
- Call plt.color()
- Pass a list of colors to color=
Answer: Pass a list of colors to color=. Pass color=['red','green','blue'] — one color per bar.
What is used to build numeric positions for grouped bars?
- np.arange(len(categories))
- plt.xticks()
- np.meshgrid()
- range strings
Answer: np.arange(len(categories)). np.arange gives integer positions you can offset for each group.
To place two grouped series side by side, you offset positions by:
- the full bar width
- half the bar width (x - width/2 and x + width/2)
- one unit
- the number of categories
Answer: half the bar width (x - width/2 and x + width/2). Shifting each series by width/2 puts the pair on either side of the center.
After offsetting grouped bars, how do you label categories under each pair?
- plt.legend()
- plt.title()
- plt.xticks(x, labels)
- plt.grid()
Answer: plt.xticks(x, labels). plt.xticks(x, labels) sets the category labels at the group positions.
Which method returns a single bar's height when adding value labels?
- bar.height()
- bar.value()
- bar.top()
- bar.get_height()
Answer: bar.get_height(). bar.get_height() returns the height so you can place text above it.
A bar chart is the right choice mainly for what kind of data?
- Categorical (named groups)
- Continuous time series
- 3D surfaces
- Geographic maps
Answer: Categorical (named groups). Bar charts compare values across discrete categories.
What causes a 'shape mismatch' error in plt.bar()?
- Too many colors
- The category and value lists have different lengths
- Missing a title
- Using barh instead of bar
Answer: The category and value lists have different lengths. Every category needs exactly one value; unequal lengths error out.
Continue this course
- Previous: Saving Figures
- Next: Histograms — Show the distribution of a dataset with bins and frequencies
- Quick reference: Matplotlib cheat sheet › Plot Types
Frequently asked questions
What is the difference between plt.bar() and plt.barh()?
plt.bar() draws vertical bars where the category sits on the x-axis and the value determines the height. plt.barh() draws horizontal bars where the category sits on the y-axis and the value determines the length — useful when you have long category labels.
How do I make grouped (side-by-side) bar charts?
Create a numeric position array with numpy's arange, then offset each group by a fixed width. For example, plt.bar(x - width/2, group_a, width) and plt.bar(x + width/2, group_b, width). Finally set the category labels with plt.xticks(x, labels).
How do I color each bar differently?
Pass a list of colors to the color= argument, one per bar: plt.bar(categories, values, color=['red', 'green', 'blue']). You can also pass a single color string to make every bar the same color.
How do I add the value on top of each bar?
Loop over the bars and call plt.text(x, height, label) for each one, positioning the text slightly above the bar's height. Many people use ax.bar_label() in newer Matplotlib versions for the same effect automatically.