Labels, Titles & Legends
Reviewed & published by Brayan K
Matplotlib is a Python library for creating charts and visualizations — but a chart without labels is a puzzle, so this lesson is about making every plot explain itself.
Part of the free Matplotlib course at LearnCodingFast — hands-on lessons with worked examples and the output they print, plus practice exercises and a quick quiz.
You'll add axis labels and a title, attach a legend that names each line, and position that legend exactly where you want it.
What You'll Learn in This Lesson
- Labeling axes with xlabel and ylabel
- Adding a chart title with plt.title
- Naming lines with the label= argument
- Showing a legend with plt.legend()
- Positioning the legend with loc
- Why a labelled chart is easier to read
1 Axis Labels and a Title
Three calls turn an anonymous chart into a clear one: plt.xlabel(), plt.ylabel(), and plt.title(). Add them any time before plt.show().
📊 The three labelling calls
- plt.xlabel("...") — names the horizontal axis
- plt.ylabel("...") — names the vertical axis
- plt.title("...") — heading above the plot
import matplotlib.pyplot as plt

month = [1, 2, 3, 4, 5, 6]
sales = [120, 150, 170, 160, 200, 240]

plt.plot(month, sales)

plt.xlabel("Month")
plt.ylabel("Sales (units)")
plt.title("Monthly Sales")

plt.show()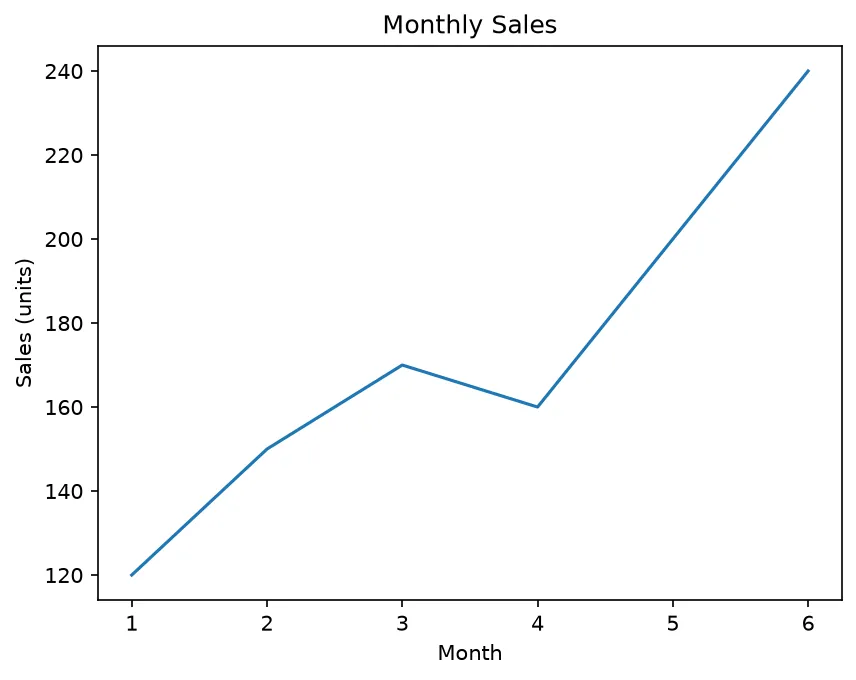
What you'll see: a rising line, now with "Month" written under the x-axis, "Sales (units)" rotated along the y-axis, and a bold "Monthly Sales" heading centered above the chart.
2 Adding a Legend
When a chart has several lines, a legend tells the reader which is which. Give each line a label=, then call plt.legend() once.
import matplotlib.pyplot as plt

month = [1, 2, 3, 4, 5, 6]
online = [80, 95, 110, 130, 150, 180]
store = [120, 115, 100, 105, 95, 90]

plt.plot(month, online, label="Online")
plt.plot(month, store, label="In-store")

plt.xlabel("Month")
plt.ylabel("Sales (units)")
plt.title("Online vs In-store")
plt.legend()

plt.show()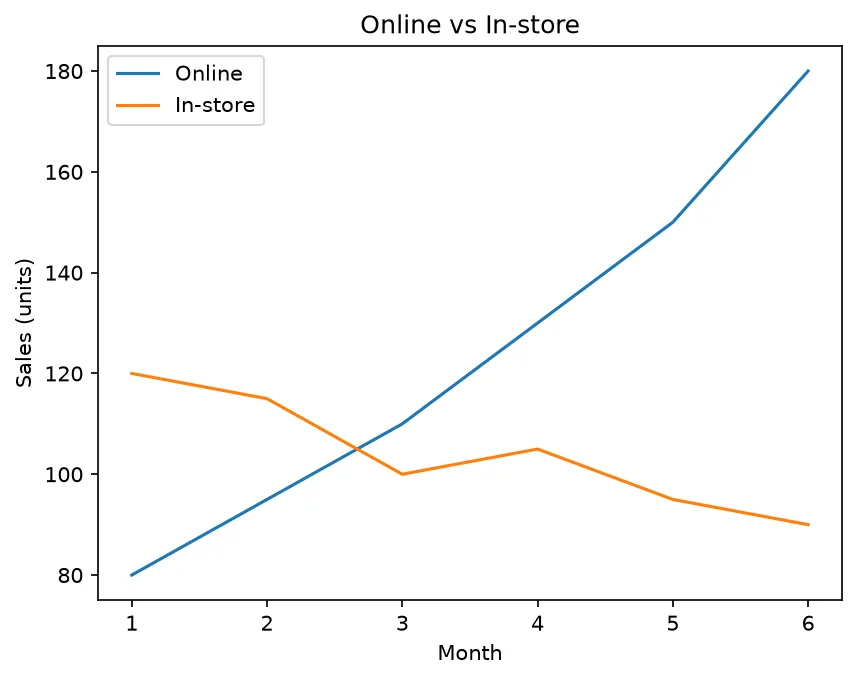
What you'll see: two lines — Online climbing and In-store falling — with a small legend box in a corner that maps each color to its name, plus the axis labels and title from before.
3 Positioning the Legend
By default Matplotlib drops the legend wherever it fits, but you can place it precisely with the loc argument — for example 'upper left' or 'lower right'.
import matplotlib.pyplot as plt

x = [1, 2, 3, 4, 5]
a = [1, 4, 9, 16, 25]
b = [2, 4, 6, 8, 10]

plt.plot(x, a, label="Squares")
plt.plot(x, b, label="Doubles")

plt.xlabel("x")
plt.ylabel("y")
plt.title("Growth Comparison")

# Pin the legend to the upper-left corner
plt.legend(loc="upper left")

plt.show()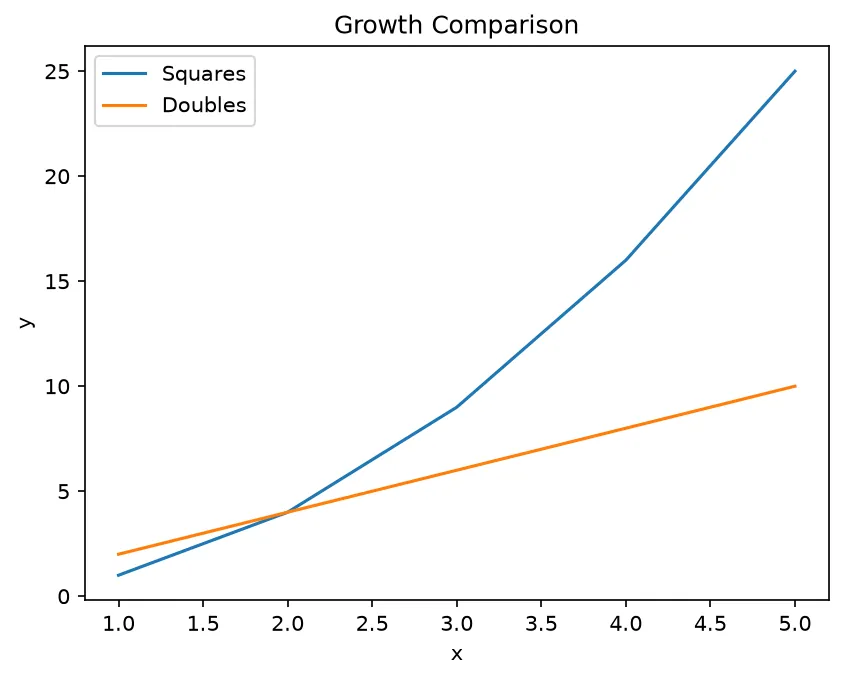
What you'll see: the steep "Squares" curve and the gentler "Doubles" line, with the legend box anchored firmly in the top-left corner instead of floating wherever Matplotlib chooses.
🎯 Your Turn: Fill in the Blanks
Replace each ___ to fully label this chart and show a legend.
import matplotlib.pyplot as plt

week = [1, 2, 3, 4]
calories = [2100, 1950, 2200, 2050]

plt.plot(week, calories, label="Intake")

# Label the horizontal axis
plt.___("Week")

# Label the vertical axis
plt.ylabel("___")

# Add a heading
plt.title("___")

# Show the legend
plt.___()

plt.show()
📋 Common Errors & Quick Reference
❌ Legend is empty / "No artists with labels"
You called plt.legend() but never passed label= to your plots. Add a label to each line.
❌ Labels disappear after plt.show()
Add your labels and legend before plt.show(). Once the figure is shown it is cleared.
| Call | What It Does |
|---|---|
| plt.xlabel("...") | Label the x-axis |
| plt.ylabel("...") | Label the y-axis |
| plt.title("...") | Add a chart heading |
| plt.plot(x, y, label="...") | Name a line for the legend |
| plt.legend(loc="upper left") | Show and position the legend |
🏆 Mini Challenge: A Fully Labelled Chart
Plot two lines and add axis labels, a title, and a positioned legend.
import matplotlib.pyplot as plt

hour = [9, 10, 11, 12, 13, 14]
team_a = [5, 8, 12, 15, 14, 18]
team_b = [3, 6, 7, 11, 13, 16]

plt.plot(hour, team_a, label="Team A")
plt.plot(hour, team_b, label="Team B")

# 1. Axis labels
plt.xlabel("Hour")
plt.ylabel("Tasks done")

# 2. Title
plt.title("Tasks Completed by Hour")

# 3. Legend in the lower right
plt.legend(loc="lower right")

plt.show()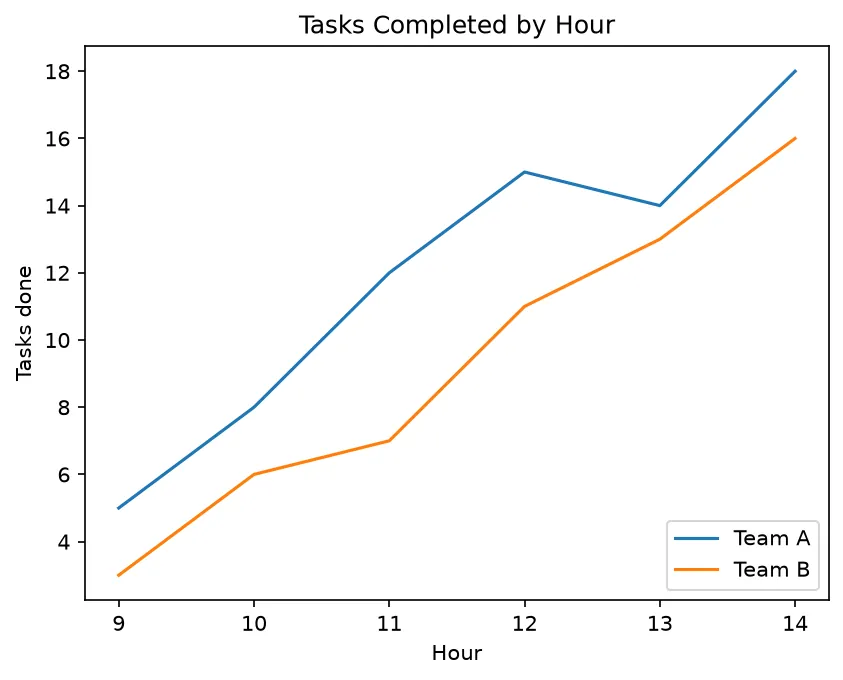
import matplotlib.pyplot as plt

x = [1, 2, 3, 4]
fig, ax = plt.subplots()
ax.plot(x, [2, 4, 6, 8], label="doubled")
ax.plot(x, [1, 4, 9, 16], label="squared")

ax.set_title("Two Series")
ax.set_xlabel("n")
ax.set_ylabel("value")
leg = ax.legend(loc="upper left", title="series")

print("Title: ", ax.get_title())
print("X label:", ax.get_xlabel())
print("Y label:", ax.get_ylabel())
print("Legend title:", leg.get_title().get_text())
print("Legend entries:", [t.get_text() for t in leg.get_texts()])
print("Entries match the labelled lines:", len(leg.get_texts()) == len(ax.lines))

# ✅ Expected output:
# Title:  Two Series
# X label: n
# Y label: value
# Legend title: series
# Legend entries: ['doubled', 'squared']
# Entries match the labelled lines: True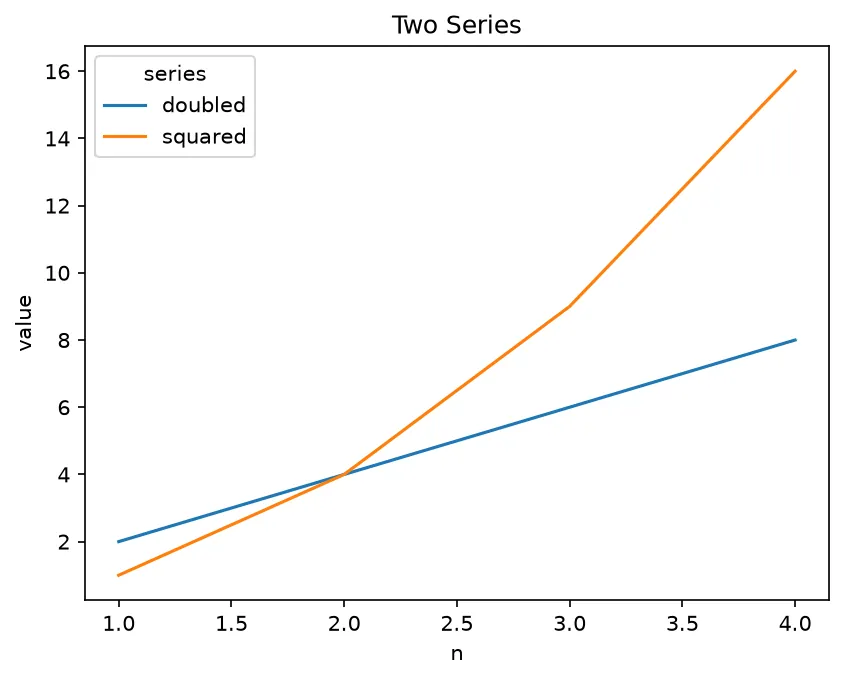
❓ Frequently Asked Questions
Lesson complete — your charts explain themselves!
You added axis labels and titles, named your lines, and placed a legend exactly where you wanted it.
Practice quiz
Which call labels the horizontal axis?
- plt.axis('x')
- plt.xname()
- plt.xlabel('text')
- plt.labelx()
Answer: plt.xlabel('text'). plt.xlabel('text') sets the label under the x-axis.
Which call labels the vertical axis?
- plt.ylabel('text')
- plt.axisy('text')
- plt.labely('text')
- plt.yname('text')
Answer: plt.ylabel('text'). plt.ylabel('text') sets the label along the y-axis.
Which call adds a heading above the chart?
- plt.heading('text')
- plt.caption('text')
- plt.header('text')
- plt.title('text')
Answer: plt.title('text'). plt.title('text') draws a heading above the plot.
How do you give a line a name for the legend?
- plt.name('Sales')
- Pass label='Sales' to plt.plot
- plt.legend('Sales')
- plt.tag('Sales')
Answer: Pass label='Sales' to plt.plot. Pass label= to each plot call, e.g. plt.plot(x, y, label='Sales').
Which call actually displays the legend box?
- plt.showlegend()
- plt.key()
- plt.legend()
- plt.labels()
Answer: plt.legend(). plt.legend() draws the legend listing every labelled line.
What does plt.legend(loc='upper left') do?
- Pins the legend to the upper-left corner
- Hides the legend
- Adds a second legend
- Removes the labels
Answer: Pins the legend to the upper-left corner. The loc argument positions the legend, here in the upper-left corner.
Why might plt.legend() show nothing and warn 'No artists with labels'?
- The title is missing
- The figure is too small
- show() was already called
- None of the plotted lines were given a label=
Answer: None of the plotted lines were given a label=. legend() only lists artists that have a label; without labels it warns and shows nothing.
What does loc='best' do?
- Doubles the legend size
- Lets Matplotlib pick the least-crowded corner
- Disables the legend
- Moves the legend off-screen
Answer: Lets Matplotlib pick the least-crowded corner. loc='best' asks Matplotlib to choose the least-crowded location automatically.
When must labels and legend be added relative to plt.show()?
- After show()
- It does not matter
- Before show(), since show clears the figure
- Only inside a loop
Answer: Before show(), since show clears the figure. Add labels and the legend before show(); once shown, the figure is cleared.
Which loc value places the legend in the bottom-right corner?
- loc='top right'
- loc='bottom'
- loc='right bottom'
- loc='lower right'
Answer: loc='lower right'. loc='lower right' anchors the legend to the bottom-right corner.
Continue this course
- Previous: Your First Line Plot
- Next: Markers, Line Styles & Colors — Control the look of your lines with colors, dashes, and markers
- Quick reference: Matplotlib cheat sheet › Labels & Legends
Frequently asked questions
How do I label the x and y axes?
Use plt.xlabel('text') for the horizontal axis and plt.ylabel('text') for the vertical axis. Add plt.title('text') for a chart heading above the plot.
How do I add a legend?
Pass a label= to each plot call, for example plt.plot(x, y, label='Sales'), then call plt.legend(). The legend box lists every line that has a label.
Why is my legend empty or missing?
plt.legend() only shows lines that were given a label= argument. If you call legend() without any labels, Matplotlib warns that there are no labelled artists and shows nothing.
Can I move the legend?
Yes. Pass loc to plt.legend(), such as plt.legend(loc='upper left') or loc='lower right'. You can also use loc='best' to let Matplotlib pick the least-crowded corner.