Your First Line Plot
Reviewed & published by Brayan K
Matplotlib is a Python library for creating charts and visualizations — and the line plot is its workhorse, perfect for showing how a value changes across an ordered sequence like time.
Part of the free Matplotlib course at LearnCodingFast — hands-on lessons with worked examples and the output they print, plus practice exercises and a quick quiz.
In this lesson you'll plot a single line, layer several series on one chart, and learn the shortcut for plotting y-values with an implicit x-axis.
What You'll Learn in This Lesson
- How plt.plot(x, y) draws a line
- Plotting multiple lines on one chart
- Passing y only with an implicit x-axis
- Drawing several series in a single call
- How Matplotlib auto-colors each line
- Reading a basic two-series comparison
1 Plotting a Single Line
The core call is plt.plot(x, y). You hand it two equal-length lists — the x-values and the y-values — and Matplotlib connects the resulting points with a line.
📊 What a line plot is good for
- Trends over time (sales per month)
- Continuous measurements (temperature per hour)
- Comparing how two quantities grow
- Any ordered sequence of numbers
import matplotlib.pyplot as plt

# x and y must be the same length
years = [2019, 2020, 2021, 2022, 2023]
revenue = [50, 65, 60, 90, 120]

plt.plot(years, revenue)

plt.show()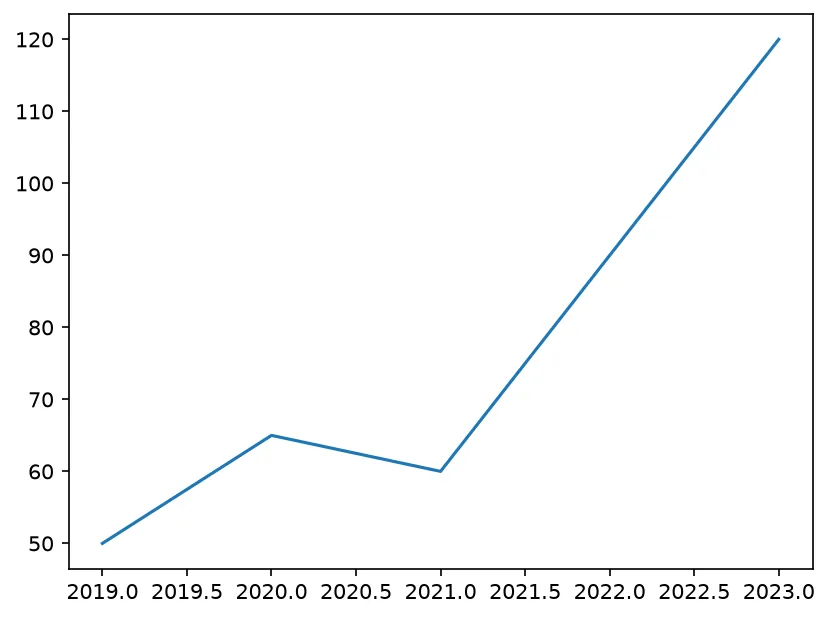
What you'll see: a single line that climbs from 50 in 2019, dips slightly in 2021, then rises sharply to 120 by 2023 — the years run along the bottom and revenue up the side.
2 Multiple Lines on One Chart
To compare two datasets, just call plt.plot() more than once before plt.show(). Every call adds a line to the same chart, and Matplotlib picks a fresh color for each.
import matplotlib.pyplot as plt

months = [1, 2, 3, 4, 5, 6]
product_a = [20, 35, 30, 45, 50, 65]
product_b = [10, 15, 25, 30, 40, 38]

# Two lines on the same chart
plt.plot(months, product_a)
plt.plot(months, product_b)

plt.show()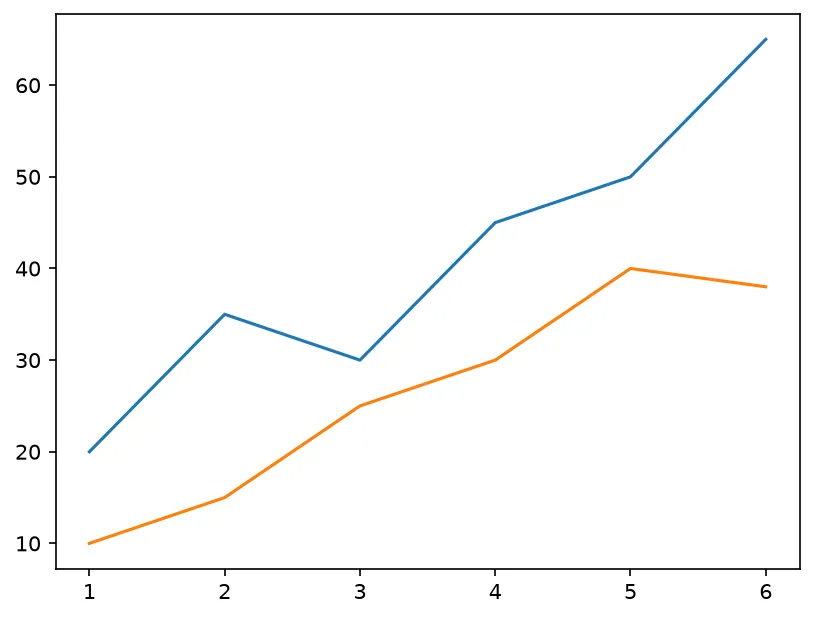
What you'll see: two lines in different colors. The first (Product A) rises steadily to 65, while the second (Product B) stays lower and flattens near the end — making the gap between them easy to read.
3 Implicit X and Multi-Series Calls
If you pass a single list, Matplotlib uses its index positions (0, 1, 2, ...) as the x-values. You can also pass several x, y pairs in one plt.plot call.
import matplotlib.pyplot as plt

# Just y-values: x becomes 0, 1, 2, 3, 4 automatically
scores = [3, 7, 5, 9, 8]
plt.plot(scores)
plt.show()

# Several series in one call: x, y1, x, y2
x = [1, 2, 3, 4]
y1 = [1, 4, 9, 16]
y2 = [1, 2, 3, 4]
plt.plot(x, y1, x, y2)
plt.show()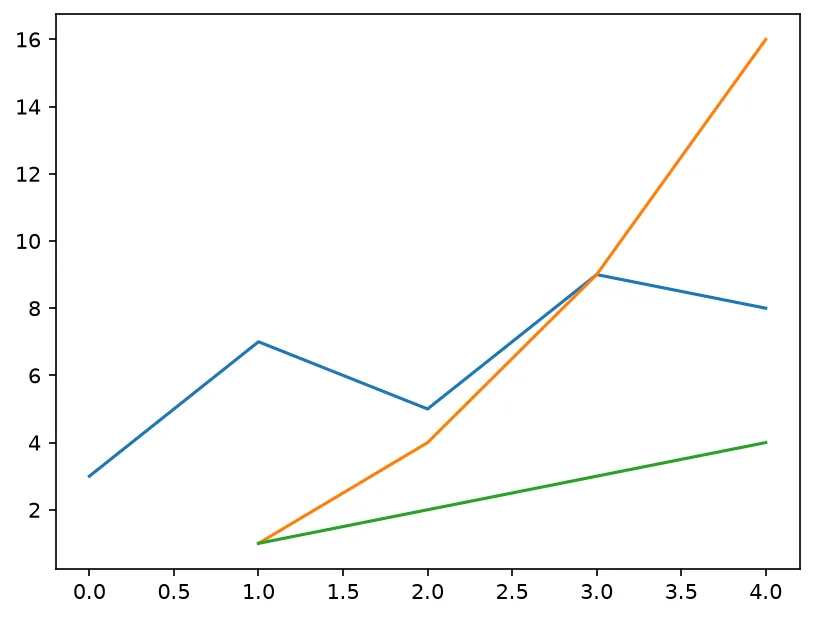
What you'll see: first a single zig-zag line indexed 0 through 4. Then a second window with two lines — a steep curve (the squares) and a straight diagonal — both drawn from one plt.plot call.
🎯 Your Turn: Fill in the Blanks
Replace each ___ to draw two lines on one chart.
import matplotlib.pyplot as plt

days = [1, 2, 3, 4, 5]
walk = [2000, 3500, 3000, 5000, 4200]
run = [500, 800, 1200, 900, 1500]

# First line: walking steps
plt.___(days, walk)

# Second line: running steps (same chart)
plt.plot(days, ___)

# Display both lines
plt.___()
📋 Common Errors & Quick Reference
❌ ValueError: x and y must have same first dimension
Your x and y lists are different lengths. Count the items in each and make them equal.
❌ Only one line shows when I expected two
Put both plt.plot() calls before a single plt.show(). A show() in between clears the figure.
| Call | What It Does |
|---|---|
| plt.plot(x, y) | Draw one line |
| plt.plot(y) | Use index as the x-axis |
| plt.plot(x, y1, x, y2) | Two series in one call |
| plt.show() | Display all queued lines |
🏆 Mini Challenge: Two-City Temperatures
Plot a week of temperatures for two cities on the same chart.
import matplotlib.pyplot as plt

days = [1, 2, 3, 4, 5, 6, 7]
london = [14, 15, 13, 16, 18, 17, 15]
madrid = [22, 24, 23, 27, 29, 28, 26]

# 1. Plot London
plt.plot(days, london)

# 2. Plot Madrid on the same chart
plt.plot(days, madrid)

# 3. Show both lines
plt.show()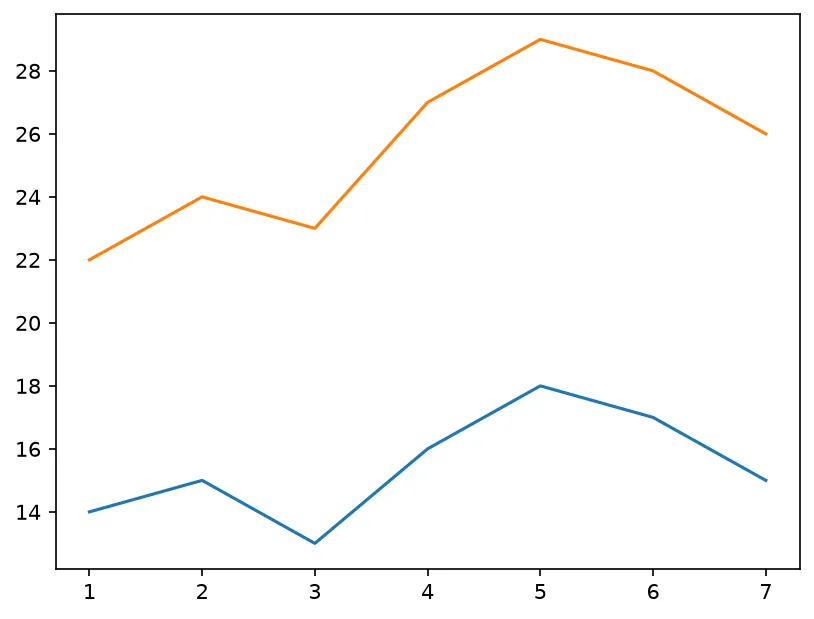
import matplotlib.pyplot as plt

x = [0, 1, 2, 3, 4]
y1 = [0, 1, 4, 9, 16]
y2 = [0, 2, 4, 6, 8]

fig, ax = plt.subplots()
ax.plot(x, y1, label="squared", linestyle="-", color="tab:blue")
ax.plot(x, y2, label="doubled", linestyle="--", color="tab:orange")
ax.legend()

print("Lines drawn:", len(ax.lines))
print("First line label:", ax.lines[0].get_label())
print("Second line style:", ax.lines[1].get_linestyle())
print("Y values of 'squared':", [int(v) for v in ax.lines[0].get_ydata()])
print("Legend entries:", [t.get_text() for t in ax.get_legend().get_texts()])
print("X axis starts below 0:", ax.get_xlim()[0] < 0)

# ✅ Expected output:
# Lines drawn: 2
# First line label: squared
# Second line style: --
# Y values of 'squared': [0, 1, 4, 9, 16]
# Legend entries: ['squared', 'doubled']
# X axis starts below 0: True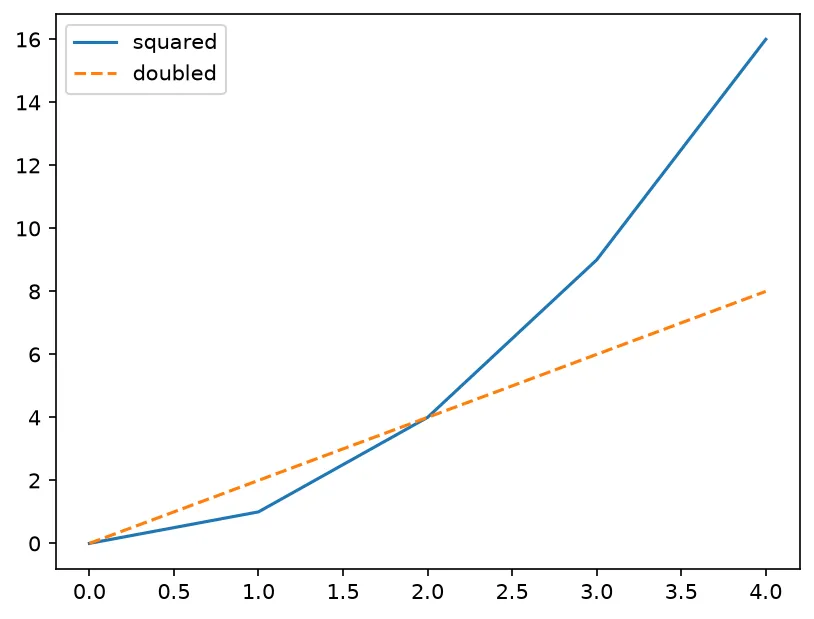
❓ Frequently Asked Questions
Lesson complete — you can draw lines!
You plotted single and multiple lines, used an implicit x-axis, and drew several series in one call.
Practice quiz
What does plt.plot(x, y) do with two equal-length lists?
- Draws a bar per value
- Makes a scatter only
- Creates a pie chart
- Connects the (x, y) points with a line
Answer: Connects the (x, y) points with a line. plt.plot(x, y) connects the points into a line.
How do you draw two lines on the same chart?
- Call plt.subplots(2)
- Call plt.plot() twice before plt.show()
- Pass two=True
- Use plt.lines()
Answer: Call plt.plot() twice before plt.show(). Each plt.plot() call before show() adds another line to the same Axes.
What does plt.plot(y) do when given a single list?
- Uses index positions 0,1,2,... as the x-values
- Raises an error
- Plots a horizontal line
- Uses random x-values
Answer: Uses index positions 0,1,2,... as the x-values. With one list, Matplotlib uses the list's index positions as x.
What does plt.plot(x, y1, x, y2) draw?
- A single averaged line
- Nothing
- Two lines in one call
- A scatter plot
Answer: Two lines in one call. Repeated x, y pairs in one call draw multiple lines.
What does Matplotlib do with the color of each new line on one Axes?
- Keeps them all black
- Uses random colors each run
- Errors on the second line
- Automatically gives each a different color
Answer: Automatically gives each a different color. Matplotlib cycles through its color cycle so each line differs.
What raises 'ValueError: x and y must have same first dimension'?
- Calling show() too early
- x and y lists of different lengths
- Plotting only one line
- Using integer data
Answer: x and y lists of different lengths. x and y must contain the same number of items.
Why might only one line appear when you expected two?
- The colors matched
- The data was too large
- A plt.show() between the calls cleared the figure
- You used plt.plot once
Answer: A plt.show() between the calls cleared the figure. A show() in between clears the figure, so put both plots before a single show().
Which call finally displays all the queued lines?
- plt.show()
- plt.render()
- plt.flush()
- plt.paint()
Answer: plt.show(). plt.show() displays everything drawn so far.
When two series share the same x-values, what should you do?
- Use two figures
- Sort one list
- Halve the y-values
- Reuse the same x list for both plot calls
Answer: Reuse the same x list for both plot calls. Reusing the same x list keeps the lines aligned on the same axis.
A line plot is best suited for which kind of data?
- Unordered categories
- An ordered sequence such as values over time
- Geographic coordinates only
- Single numbers
Answer: An ordered sequence such as values over time. Line plots show how a value changes across an ordered sequence like time.
Continue this course
- Previous: The Figure & Axes
- Next: Labels, Titles & Legends — Add axis labels, a title, and a legend to make charts readable
- Quick reference: Matplotlib cheat sheet › Basics
Frequently asked questions
How do I plot more than one line on the same chart?
Call plt.plot() once for each line before plt.show(). Each call adds a new line to the same Axes, and Matplotlib automatically gives each one a different color.
Do I always need to pass both x and y?
No. If you call plt.plot(y) with a single list, Matplotlib uses the list's index positions (0, 1, 2, ...) as the x-values automatically.
Can plt.plot draw several series in one call?
Yes. You can pass repeated x, y pairs like plt.plot(x, y1, x, y2) to draw multiple lines with one call, though calling plt.plot once per line is usually clearer.
Why do my lines all look the same color?
If you build them with separate Axes or reset the figure between calls, the color cycle restarts. Plot all lines on the same Axes before show() and they will each get a distinct color.