The Figure & Axes
Reviewed & published by Brayan K
Matplotlib is a Python library for creating charts and visualizations — and every chart you draw lives inside two objects: a Figure (the whole canvas) and one or more Axes (the individual plot areas).
Part of the free Matplotlib course at LearnCodingFast — hands-on lessons with worked examples and the output they print, plus practice exercises and a quick quiz.
In this lesson you'll meet fig, ax = plt.subplots() and learn the difference between the quick pyplot interface and the explicit object-oriented interface.
What You'll Learn in This Lesson
- What a Figure is and what an Axes is
- How fig, ax = plt.subplots() creates both
- The pyplot state-machine interface (plt.plot)
- The object-oriented interface (ax.plot)
- Setting figure size with figsize
- Adding a figure-wide title with fig.suptitle
1 The Figure and the Axes
Think of the Figure as a blank sheet of paper and an Axes as a single chart drawn on that paper. A Figure can hold one Axes or a whole grid of them, but each Axes has its own data, x-axis, and y-axis.
📊 The two core objects
- Figure — the overall container (size, background, super-title)
- Axes — one plot region with its data and ticks
- One Figure → many Axes (subplots)
- fig.suptitle() titles the whole Figure
- ax.set_title() titles a single Axes
The cleanest way to get both at once is plt.subplots(), which returns a Figure and an Axes together so you always know exactly which object you're working with.
import matplotlib.pyplot as plt

# Create a Figure and a single Axes together
fig, ax = plt.subplots()

x = [1, 2, 3, 4, 5]
y = [2, 5, 3, 8, 7]

# Draw on the Axes (object-oriented interface)
ax.plot(x, y)

plt.show()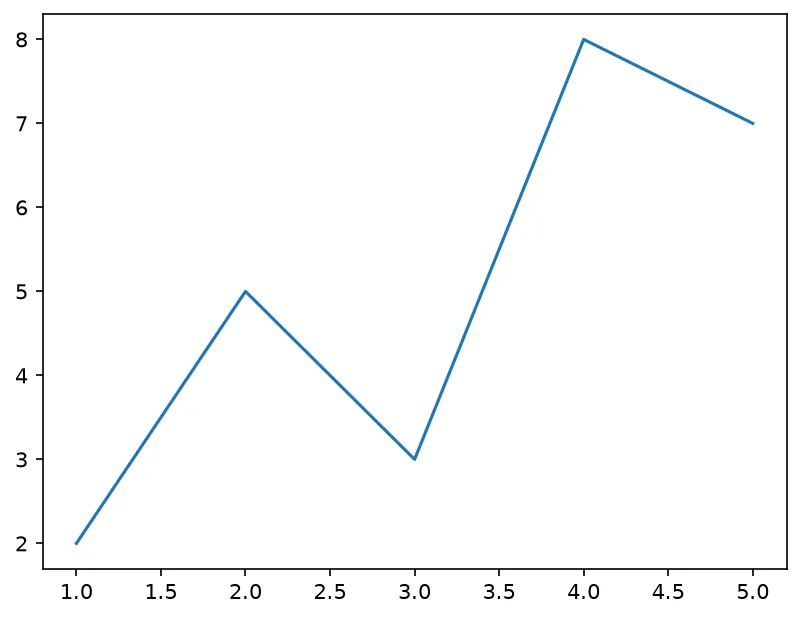
What you'll see: a single chart with a blue line that rises, dips, peaks at x=4, then eases down. It looks just like a normal plot — but now you hold explicit references to the Figure (fig) and the Axes (ax).
2 pyplot vs. Object-Oriented Interface
Matplotlib offers two ways to build the same chart. The pyplot interface (plt.plot) quietly tracks a "current" Axes for you. The object-oriented interface (ax.plot) makes that Axes explicit.
import matplotlib.pyplot as plt

x = [0, 1, 2, 3, 4]
y = [0, 1, 4, 9, 16]

# --- pyplot (state-machine) style ---
plt.plot(x, y)
plt.title("pyplot style")
plt.show()

# --- object-oriented style: exactly the same chart ---
fig, ax = plt.subplots()
ax.plot(x, y)
ax.set_title("object-oriented style")
plt.show()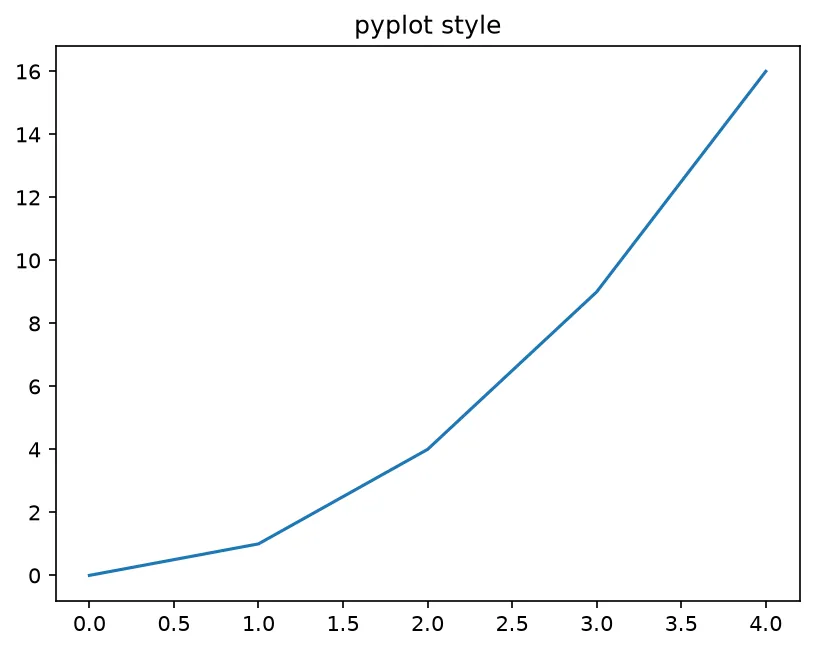
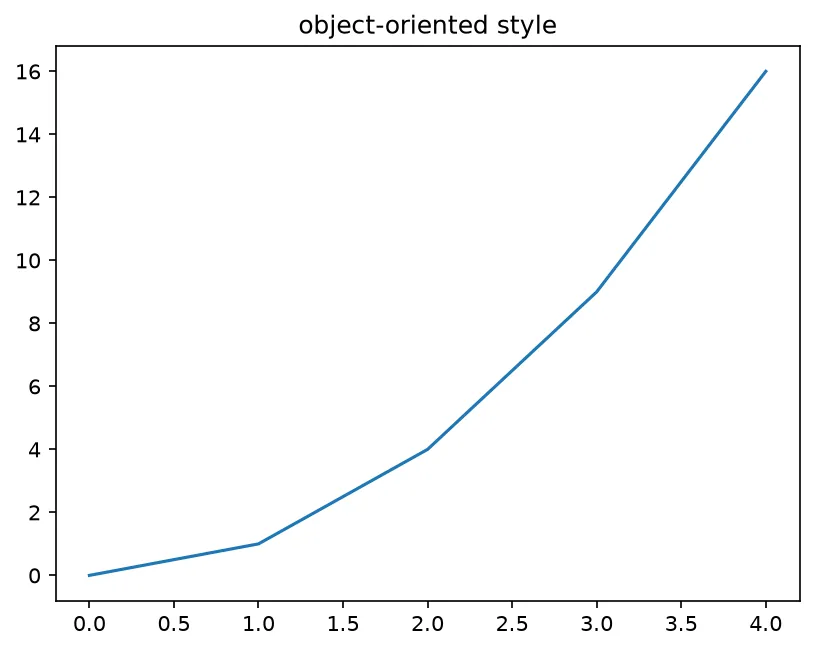
What you'll see: two windows, one after the other, each showing the same upward parabola. The only difference is the code style — plt.title versus ax.set_title — proving the two interfaces produce identical results.
3 Figure Size and Super-Titles
You control how big the canvas is with figsize=(width, height) in inches, and you can give the whole Figure a heading with fig.suptitle().
import matplotlib.pyplot as plt

# A wide, short canvas: 8 inches by 4 inches
fig, ax = plt.subplots(figsize=(8, 4))

x = [1, 2, 3, 4, 5, 6]
y = [10, 12, 9, 14, 13, 17]

ax.plot(x, y)

# A title for the entire Figure
fig.suptitle("Monthly Visitors")

plt.show()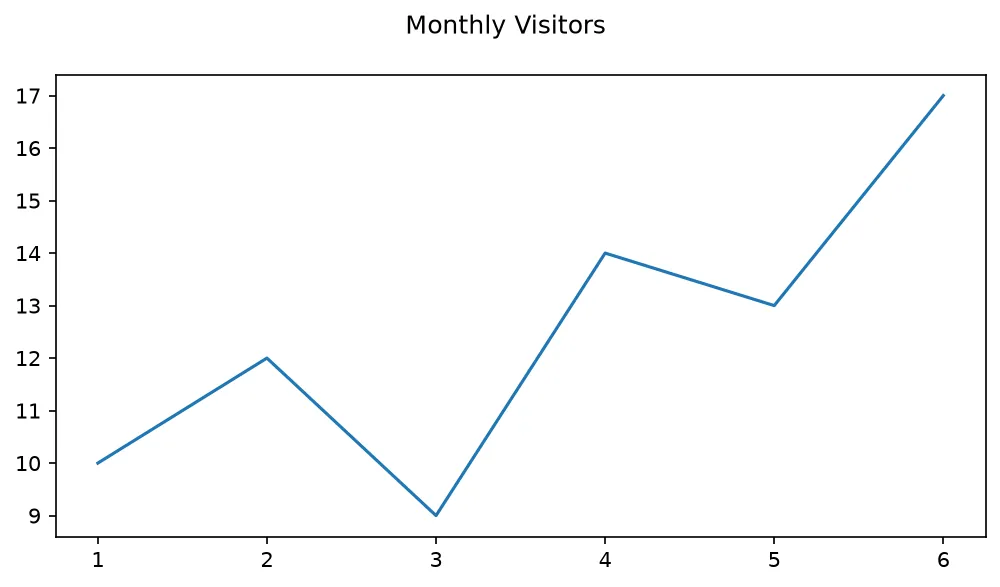
What you'll see: a noticeably wider-than-tall chart with a bold "Monthly Visitors" heading across the very top of the Figure, sitting above the plotted line.
🎯 Your Turn: Fill in the Blanks
Replace each ___ to build a Figure and Axes and draw on it.
import matplotlib.pyplot as plt

# Create a Figure and Axes that is 6 by 4 inches
fig, ax = plt.___(figsize=(6, 4))

x = [1, 2, 3, 4]
y = [5, 9, 7, 12]

# Draw on the Axes (not plt)
ax.___(x, y)

# Title the whole Figure
fig.___("My Chart")

plt.show()
📋 Common Errors & Quick Reference
❌ AttributeError: 'Axes' object has no attribute 'title'
On an Axes use ax.set_title("..."), not ax.title("..."). The plain title form belongs to plt.
❌ Only one chart shows when I expected two
Each plt.show() displays and then clears the current figure. Build a fresh fig, ax for the next chart.
| Call | What It Does |
|---|---|
| fig, ax = plt.subplots() | Create a Figure and one Axes |
| plt.subplots(figsize=(8, 4)) | Set canvas size in inches |
| ax.plot(x, y) | Draw on a specific Axes |
| fig.suptitle("...") | Title the entire Figure |
🏆 Mini Challenge: A Titled Figure
Build a wide Figure with one Axes, plot some data, and add a figure-wide title.
import matplotlib.pyplot as plt

# 1. Create a 9x4 inch Figure and Axes
fig, ax = plt.subplots(figsize=(9, 4))

weeks = [1, 2, 3, 4, 5, 6, 7, 8]
signups = [12, 18, 25, 22, 30, 35, 33, 40]

# 2. Plot on the Axes
ax.plot(weeks, signups)

# 3. Add a figure-wide title
fig.suptitle("Weekly Sign-ups")

plt.show()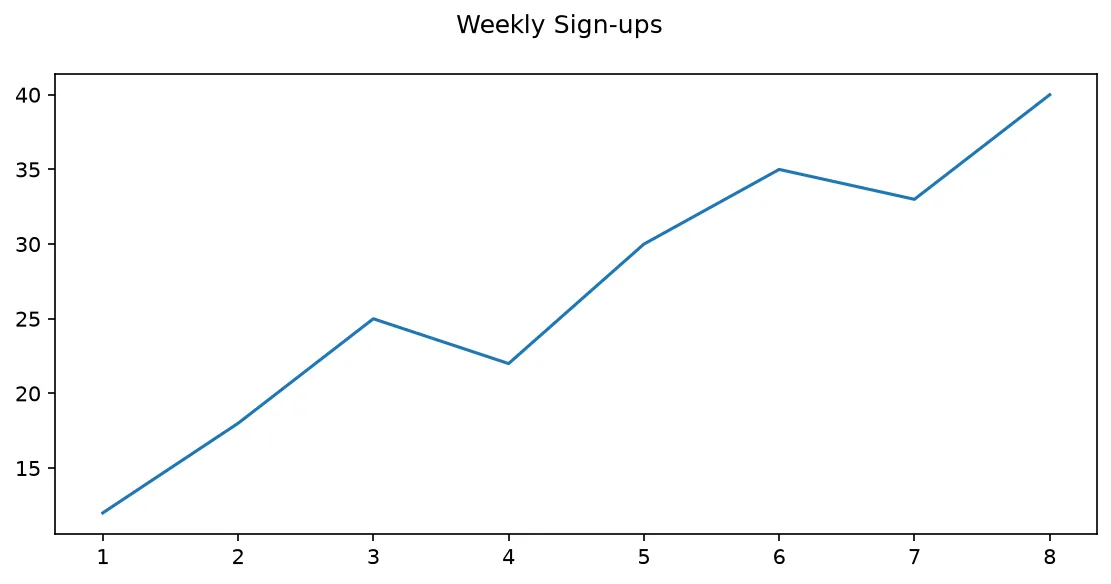
import matplotlib.pyplot as plt

fig, axes = plt.subplots(2, 2, figsize=(8, 6))

axes[0][0].plot([1, 2, 3], [1, 4, 9])
axes[0][1].bar(["a", "b"], [3, 5])
axes[1][0].scatter([1, 2, 3], [3, 2, 1])
axes[1][1].axis("off")

fig.suptitle("Four panels")

print("Shape of the axes grid:", axes.shape)
print("Axes on the figure:", len(fig.axes))
print("Figure size:", fig.get_size_inches().tolist())
print("Super title:", fig.get_suptitle())
print("Top-left has a line:", len(axes[0][0].lines) == 1)
print("Top-right has bars:", len(axes[0][1].patches) == 2)
print("Bottom-right axis is hidden:", not axes[1][1].axison)

# ✅ Expected output:
# Shape of the axes grid: (2, 2)
# Axes on the figure: 4
# Figure size: [8.0, 6.0]
# Super title: Four panels
# Top-left has a line: True
# Top-right has bars: True
# Bottom-right axis is hidden: True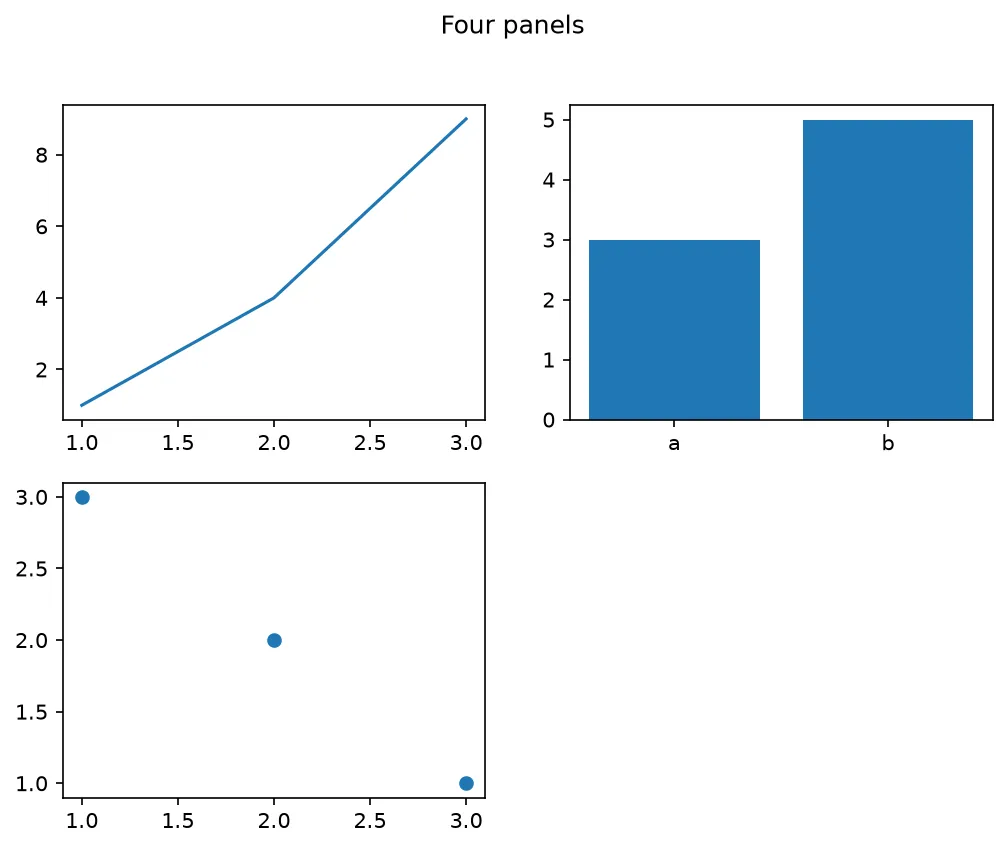
❓ Frequently Asked Questions
Lesson complete — you understand the canvas!
You learned that a Figure holds Axes, met plt.subplots(), and saw the difference between the pyplot and object-oriented interfaces.
Practice quiz
In Matplotlib, what is the Figure?
- A single plot area with one x and y axis
- The whole canvas that holds everything
- A line drawn on a chart
- The colormap
Answer: The whole canvas that holds everything. The Figure is the overall container; an Axes is a single plot area inside it.
What is an Axes?
- The whole window
- A single plot area with its own x and y axis
- A list of tick labels
- The figure title
Answer: A single plot area with its own x and y axis. An Axes is one plot region with its own data, x-axis, and y-axis.
What does fig, ax = plt.subplots() return?
- Two Axes
- Two Figures
- A Figure and an Axes
- A Figure and a colorbar
Answer: A Figure and an Axes. plt.subplots() creates a Figure and (by default) a single Axes and returns both.
How many Axes can one Figure contain?
- Exactly one
- At most two
- Many (a grid of subplots)
- Zero
Answer: Many (a grid of subplots). One Figure can hold one Axes or a whole grid of them.
Which call sets the figure size to 8 by 4 inches?
- plt.subplots(size=8x4)
- plt.subplots(figsize=(8, 4))
- plt.subplots(dpi=(8, 4))
- plt.subplots(inches=8, 4)
Answer: plt.subplots(figsize=(8, 4)). figsize=(width, height) in inches sets the canvas size; width comes first.
Which method titles a single Axes?
- ax.set_title()
- fig.suptitle()
- ax.title()
- plt.figtitle()
Answer: ax.set_title(). ax.set_title() titles one Axes; fig.suptitle() titles the whole Figure.
Which method adds a title across the entire Figure?
- ax.set_title()
- ax.suptitle()
- fig.suptitle()
- plt.axtitle()
Answer: fig.suptitle(). fig.suptitle() places a heading over the whole Figure.
The pyplot interface (plt.plot) is best described as...
- The object-oriented interface
- A state-machine that tracks the current Axes
- A 3D plotting mode
- An animation tool
Answer: A state-machine that tracks the current Axes. plt.plot uses the pyplot state machine, drawing on the implicit current Axes.
Which style scales best to complex, multi-subplot figures?
- The implicit plt.plot style
- The object-oriented ax.plot style
- Neither works for subplots
- Only plt.show()
Answer: The object-oriented ax.plot style. The explicit object-oriented (fig, ax) style scales better as figures grow complex.
In figsize=(8, 4), which dimension comes first?
- Height
- Width
- DPI
- Aspect ratio
Answer: Width. figsize is (width, height) in inches, so width always comes first.
Continue this course
- Previous: Introduction to Matplotlib
- Next: Your First Line Plot — Draw a line chart from lists of x and y data with plt.plot
- Quick reference: Matplotlib cheat sheet › Basics
Frequently asked questions
What is the difference between a Figure and an Axes?
The Figure is the whole window or page that holds everything. An Axes is a single plot area inside that Figure — with its own x-axis, y-axis, and data. One Figure can contain many Axes.
What does fig, ax = plt.subplots() do?
It creates a Figure and a single Axes at the same time and returns both. You then draw on the Axes with ax.plot(...) and adjust the Figure with fig methods like fig.suptitle(...).
Should I use plt.plot or ax.plot?
Both work. plt.plot uses the implicit 'current axes' (the pyplot state-machine interface), which is quick for one-off charts. ax.plot uses the object-oriented interface, which is explicit and scales better to complex, multi-plot figures.
How do I control the figure size?
Pass figsize=(width, height) in inches to plt.figure() or plt.subplots(), for example plt.subplots(figsize=(8, 4)). Width comes first, height second.