Introduction to Matplotlib
Reviewed & published by Brayan K
Matplotlib is a Python library for creating charts and visualizations — it turns raw lists of numbers into clear line plots, bar charts, histograms, and more that you can save, share, and explore.
Part of the free Matplotlib course at LearnCodingFast — hands-on lessons with worked examples and the output they print, plus practice exercises and a quick quiz.
In this first lesson you'll install Matplotlib, import it the standard way, and render your very first chart.
What You'll Learn in This Lesson
- What Matplotlib is and what it's used for
- How to install it with pip
- The standard pyplot import convention
- How to draw and display your first chart
- The difference between plt.show() and savefig()
- Where Matplotlib fits in the data ecosystem
1 What Is Matplotlib?
Matplotlib is the most widely used plotting library in Python. It lets you transform data — numbers in lists, arrays, or DataFrames — into visual charts that humans can actually understand at a glance.
📊 What can it draw?
- Line plots — trends over time
- Bar charts — comparing categories
- Histograms — the shape of a distribution
- Scatter plots — relationships between variables
- Pie charts, heatmaps, 3D surfaces, and more
Almost every Python data tool — pandas, seaborn, scikit-learn — builds on top of Matplotlib, so learning it gives you a foundation for the entire data-visualization world.
2 Installing and Importing Matplotlib
Matplotlib isn't built into Python, so install it once from your terminal:
pip install matplotlibThen, in your Python file, import the pyplot module. Almost everyone uses the alias plt:
import matplotlib.pyplot as pltimport matplotlib.pyplot as plt
# Two simple lists of data
months = [1, 2, 3, 4, 5]
sales = [100, 140, 120, 200, 240]
# Draw a line connecting the points
plt.plot(months, sales)
# Display the chart in a window
plt.show()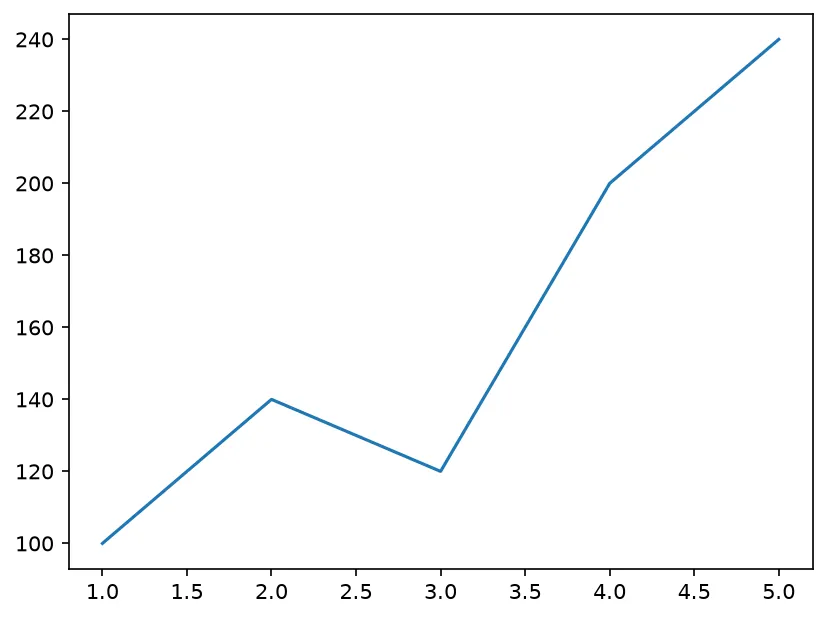
What you'll see: a window opens with a blue line rising from 100 up to 240, with the five month numbers along the bottom (x-axis) and the sales values up the side (y-axis). That's a complete chart in just three lines of real code.
3 Showing vs. Saving a Chart
There are two ways to get your chart out of Python: plt.show() opens an interactive window, while plt.savefig() writes the chart to an image file on disk.
import matplotlib.pyplot as plt

x = [0, 1, 2, 3, 4]
y = [0, 1, 4, 9, 16]   # squares of x

plt.plot(x, y)

# Save the chart as a PNG image instead of (or as well as) showing it
plt.savefig("squares.png")

# Then display it on screen too
plt.show()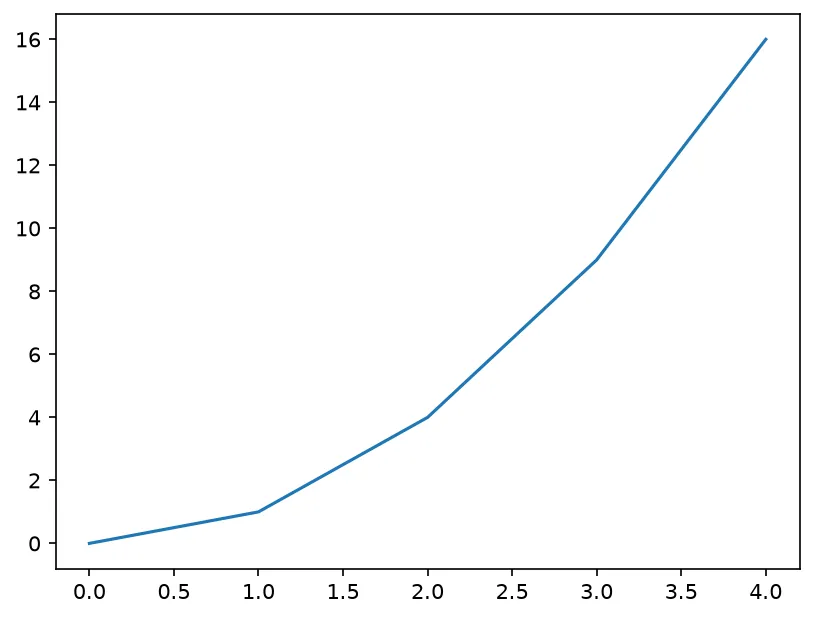
What you'll see: a smooth upward curve (a parabola, because y is x squared). A file named squares.png is also written to your working folder — open it and you'll see the exact same chart as an image.
🎯 Your Turn: Fill in the Blanks
Replace each ___ to plot a small dataset and display it.
import matplotlib.pyplot as ___   # the standard alias

days = [1, 2, 3, 4]
steps = [3000, 5500, 4200, 8000]

# Plot the data
plt.___(days, steps)

# Display the chart
plt.___()
📋 Common Errors & Quick Reference
❌ ModuleNotFoundError: No module named 'matplotlib'
You haven't installed it. Run pip install matplotlib in your terminal first.
❌ Nothing appears on screen
You forgot plt.show(). In a plain script the window only opens when you call it.
| Call | What It Does |
|---|---|
| import matplotlib.pyplot as plt | Standard import |
| plt.plot(x, y) | Draw a line plot |
| plt.show() | Open the chart window |
| plt.savefig("name.png") | Save chart to a file |
🏆 Mini Challenge: Temperature Trend
Plot a week of daily temperatures and save the chart to a file.
import matplotlib.pyplot as plt

days = [1, 2, 3, 4, 5, 6, 7]
temps_c = [14, 16, 15, 19, 21, 20, 18]

# 1. Plot the temperatures
plt.plot(days, temps_c)

# 2. Save it as 'week_temps.png'
plt.savefig("week_temps.png")

# 3. Show it on screen
plt.show()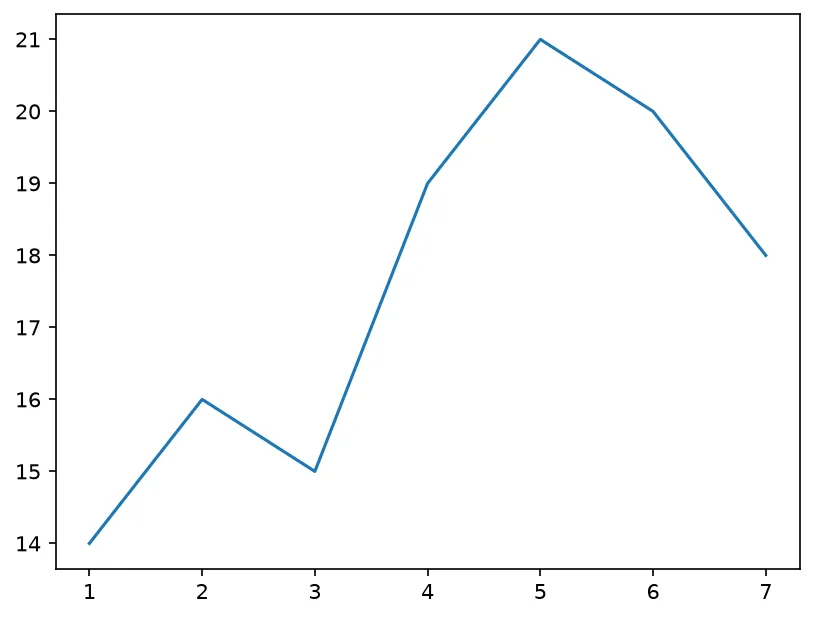
import matplotlib.pyplot as plt

months = ["Jan", "Feb", "Mar", "Apr"]
sales = [120, 145, 132, 178]

fig, ax = plt.subplots()
ax.plot(months, sales, marker="o")
ax.set_title("Sales by Month")

print("Figure size in inches:", fig.get_size_inches().tolist())
print("Figures open:", len(plt.get_fignums()))
print("Axes on the figure:", len(fig.axes))
print("Lines on the axes:", len(ax.lines))
print("Points plotted:", len(ax.lines[0].get_ydata()))
print("Title:", ax.get_title())

# ✅ Expected output:
# Figure size in inches: [6.4, 4.8]
# Figures open: 1
# Axes on the figure: 1
# Lines on the axes: 1
# Points plotted: 4
# Title: Sales by Month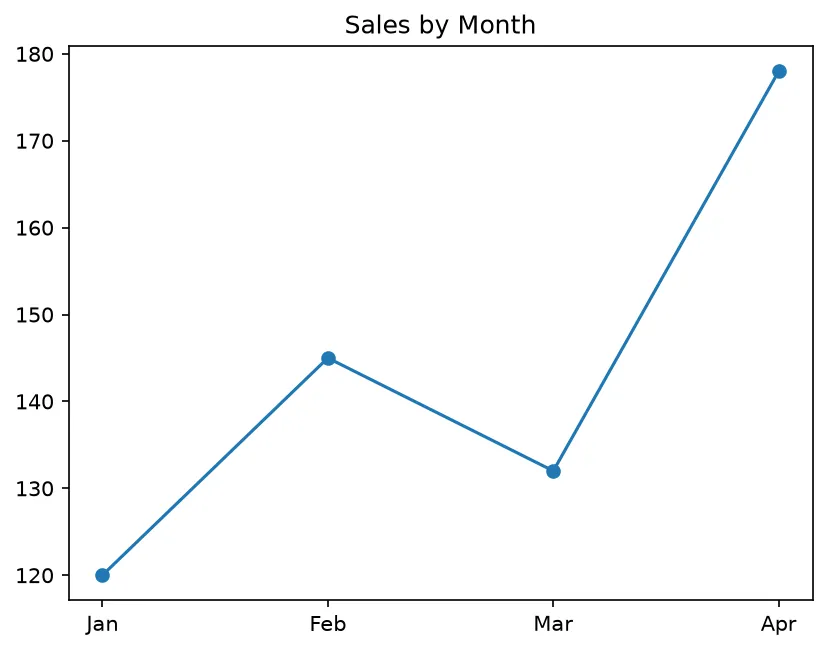
❓ Frequently Asked Questions
Lesson complete — you've drawn your first chart!
You installed Matplotlib, imported pyplot the standard way, and rendered and saved a real chart with just a few lines of code.
Practice quiz
What kind of library is Matplotlib?
- A web framework
- A plotting and visualization library
- A database driver
- A unit-testing tool
Answer: A plotting and visualization library. Matplotlib is Python's most widely used library for creating charts and visualizations.
Which command installs Matplotlib?
- import matplotlib
- python matplotlib
- pip install matplotlib
- plt install
Answer: pip install matplotlib. Matplotlib is not in the standard library, so you install it with pip install matplotlib.
What is the standard import line for pyplot?
- import matplotlib.pyplot as plt
- import pyplot as plt
- from matplotlib import plt
- import matplotlib as plt
Answer: import matplotlib.pyplot as plt. The conventional alias is plt: import matplotlib.pyplot as plt.
Which call draws a line connecting points from two lists?
- plt.draw(x, y)
- plt.line(x, y)
- plt.show(x, y)
- plt.plot(x, y)
Answer: plt.plot(x, y). plt.plot(x, y) connects the (x, y) points with a line.
Which call opens an interactive window showing the chart?
- plt.show()
- plt.display()
- plt.render()
- plt.open()
Answer: plt.show(). plt.show() opens the figure window in a plain script.
Which call writes the chart to an image file?
- plt.export()
- plt.write()
- plt.savefig('chart.png')
- plt.tofile()
Answer: plt.savefig('chart.png'). plt.savefig('name.png') saves the figure to disk as an image.
Why should savefig() be called before show()?
- savefig is faster than show
- show requires a filename
- Order does not matter at all
- show() clears the figure, so a later savefig would be blank
Answer: show() clears the figure, so a later savefig would be blank. After show() closes the window the figure is cleared, so call savefig() first.
If you call plt.plot but see nothing in a script, what is the likely cause?
- You used the wrong color
- You forgot plt.show()
- The data was too small
- You must call plt.draw twice
Answer: You forgot plt.show(). In a plain script the window only appears when you call plt.show().
What error means Matplotlib is not installed?
- SyntaxError
- ValueError
- ModuleNotFoundError: No module named 'matplotlib'
- ImportWarning
Answer: ModuleNotFoundError: No module named 'matplotlib'. ModuleNotFoundError appears when the package has not been installed with pip.
Which tools commonly build on top of Matplotlib?
- pandas, seaborn, and scikit-learn
- numpy only
- the os and sys modules
- requests and flask
Answer: pandas, seaborn, and scikit-learn. Many data tools like pandas, seaborn, and scikit-learn build their plotting on Matplotlib.
Continue this course
- Next: The Figure & Axes — Understand the Figure and Axes objects that hold every plot
- Quick reference: Matplotlib cheat sheet › Basics
Frequently asked questions
What is Matplotlib used for?
Matplotlib is a Python library for creating static, animated, and interactive charts and visualizations — line plots, bar charts, histograms, scatter plots, and much more — directly from your data.
Do I need to install Matplotlib separately?
Yes. Matplotlib is not part of the Python standard library. Install it with 'pip install matplotlib'. If you use Anaconda, it is already included.
What is pyplot?
pyplot is a module inside Matplotlib that provides a simple, MATLAB-style interface for building plots. It is conventionally imported as 'import matplotlib.pyplot as plt'.
How do I display a chart?
After building your plot, call plt.show() to open a window with the figure. In notebooks the figure usually appears inline automatically.