Polar Plots
Reviewed & published by Brayan K
A polar plot positions each point by an angle and a radius instead of x and y, wrapping your data around a circle — ideal for directions, cycles, and radar-style comparisons.
Part of the free Matplotlib course at LearnCodingFast — hands-on lessons with worked examples and the output they print, plus practice exercises and a quick quiz.
In this lesson you'll create polar axes, plot curves with theta and r, build a polar bar (radar-style) chart, and control the angle direction, offset, and radial ticks.
What You'll Learn in This Lesson
- Creating polar axes with subplot_kw
- Plotting curves with theta and r
- Building a polar bar (radar-style) chart
- Moving zero with set_theta_zero_location
- Reversing direction with set_theta_direction
- Customizing radial ticks with set_rticks
1 Creating Polar Axes
Polar plots live on special axes. Create them by passing subplot_kw={"projection": "polar"} to plt.subplots(). Then plot as usual, but the first argument is the angle theta in radians and the second is the radius r. The result wraps around a circle instead of running along a straight axis.
import matplotlib.pyplot as plt
import numpy as np

theta = np.linspace(0, 2 * np.pi, 300)
r = 1 + np.sin(4 * theta)   # a four-petal rose

fig, ax = plt.subplots(subplot_kw={"projection": "polar"})
ax.plot(theta, r, color="darkviolet")

ax.set_title("A Polar Rose Curve")

plt.show()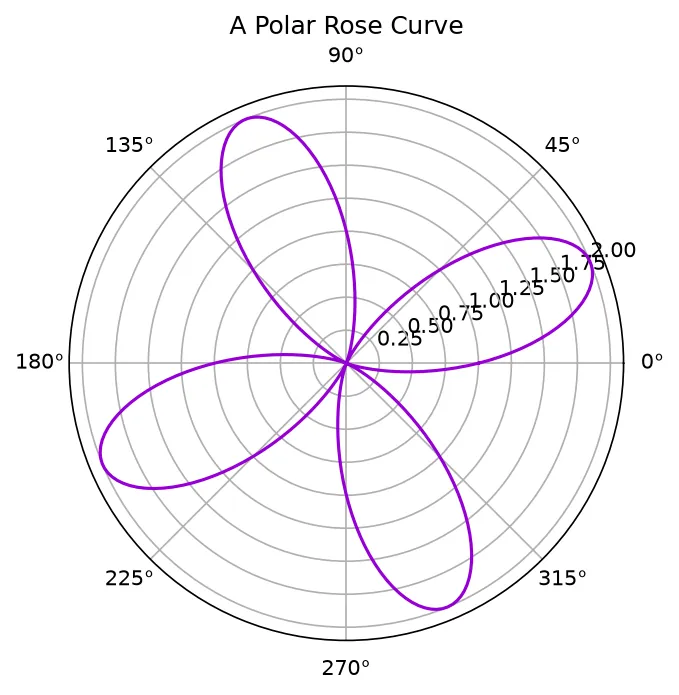
What you'll see: a symmetrical flower-like curve with several petals radiating from the center. The angular gridlines fan out like spokes and the circular gridlines mark the radius, giving the plot its distinctive round frame.
2 Polar Bars: Radar-Style Charts
Call ax.bar() on polar axes and each bar becomes a wedge fanning out from the center — a layout that reads like a radar or wind-rose chart. Space the categories evenly around the circle with np.linspace(0, 2 * np.pi, n, endpoint=False), then label each angle with ax.set_xticks() and ax.set_xticklabels().
import matplotlib.pyplot as plt
import numpy as np

skills = ["Speed", "Power", "Defense", "Stamina", "Skill", "Luck"]
values = [8, 6, 9, 7, 8, 5]
n = len(skills)

angles = np.linspace(0, 2 * np.pi, n, endpoint=False)

fig, ax = plt.subplots(subplot_kw={"projection": "polar"})
bars = ax.bar(angles, values, width=2 * np.pi / n,
              color="seagreen", alpha=0.6, edgecolor="black")

ax.set_xticks(angles)
ax.set_xticklabels(skills)
ax.set_title("Player Stats (Polar Bars)")

plt.show()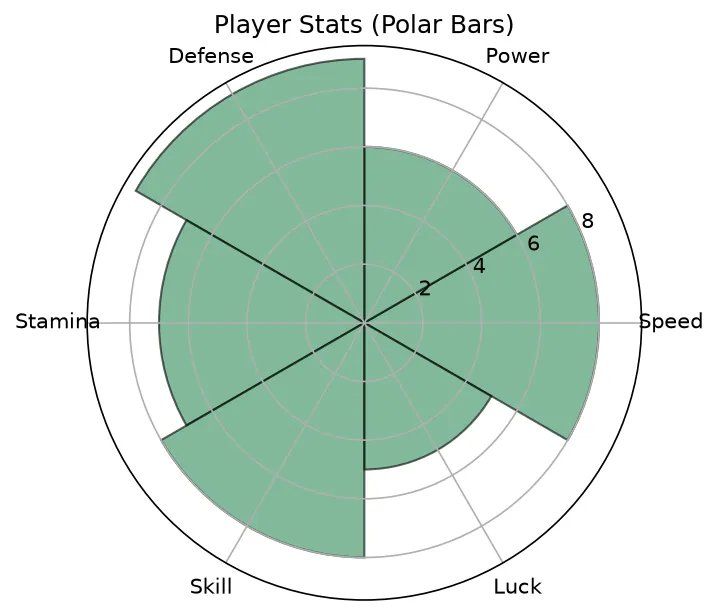
What you'll see: six green wedges spreading out from the center like slices of a fan, each reaching a different distance based on its stat. The category names sit around the rim, making it easy to spot that Defense (the longest wedge) is this player's strength.
3 Direction, Offset & Radial Ticks
By default zero degrees points right and angles grow counter-clockwise — but compasses and clocks don't work that way. Use ax.set_theta_zero_location("N") to put zero at the top and ax.set_theta_direction(-1) to sweep clockwise. Tidy up the radius with ax.set_rticks() and cap it with ax.set_rmax().
import matplotlib.pyplot as plt
import numpy as np

# Wind measured at 8 compass directions
dirs = ["N", "NE", "E", "SE", "S", "SW", "W", "NW"]
speed = [4, 6, 9, 7, 5, 3, 6, 8]
n = len(dirs)
angles = np.linspace(0, 2 * np.pi, n, endpoint=False)

fig, ax = plt.subplots(subplot_kw={"projection": "polar"})
ax.bar(angles, speed, width=2 * np.pi / n,
       color="steelblue", alpha=0.7, edgecolor="white")

# Make it read like a compass
ax.set_theta_zero_location("N")
ax.set_theta_direction(-1)         # clockwise
ax.set_xticks(angles)
ax.set_xticklabels(dirs)
ax.set_rticks([2, 4, 6, 8])
ax.set_title("Wind Speed by Direction")

plt.show()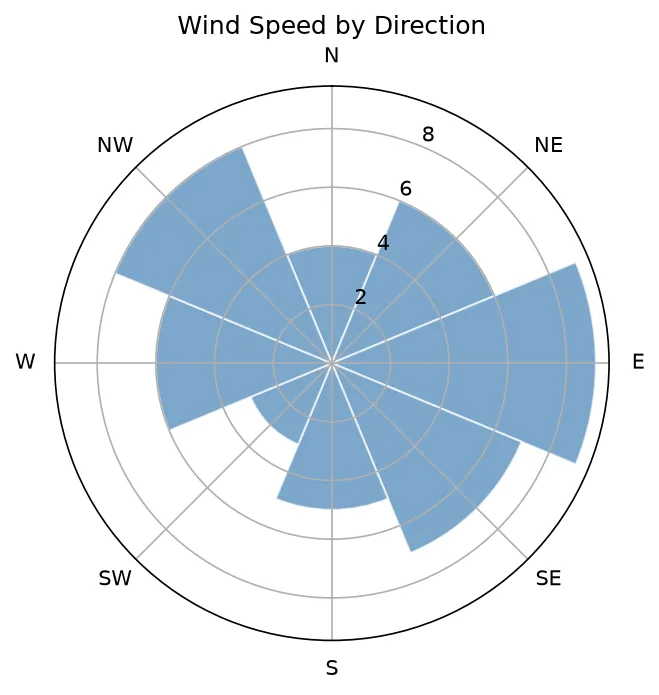
What you'll see: a wind rose where North sits at the very top and the directions run clockwise N to E to S to W, just like a real compass. The blue wedges show wind strength per direction, and the radial rings are labeled at 2, 4, 6, and 8.
🎯 Your Turn: Fill in the Blanks
Replace each ___ to create polar axes and plot a spiral that runs clockwise.
import matplotlib.pyplot as plt
import numpy as np

theta = np.linspace(0, 6 * np.pi, 300)
r = theta   # radius grows with angle = a spiral

# Create polar axes
fig, ax = plt.subplots(subplot_kw={"projection": ___})

ax.plot(theta, r, color="orange")

# Make angles increase clockwise
ax.set_theta_direction(___)

plt.show()
📋 Common Errors & Quick Reference
❌ The plot is a normal square, not a circle
You forgot the projection. Pass subplot_kw={"projection": "polar"} to plt.subplots().
❌ The curve looks wrong or squished
Angles must be in radians. Convert degrees with np.radians(deg) or build them from np.pi.
❌ Two categories overlap at the top
Use endpoint=False in np.linspace so the last angle doesn't duplicate the first.
| Call | What It Does |
|---|---|
| subplot_kw={"projection":"polar"} | Make polar axes |
| ax.plot(theta, r) | Curve by angle and radius |
| ax.bar(angles, vals) | Radar-style wedges |
| ax.set_theta_zero_location("N") | Move the zero angle |
| ax.set_theta_direction(-1) | Sweep clockwise |
🎯 Mini-Challenge: Compare Two Players
Draw a radar-style line chart comparing two players across six skills. Close each loop so the shapes connect all the way around.
import matplotlib.pyplot as plt
import numpy as np

skills = ["Speed", "Power", "Defense", "Stamina", "Skill", "Luck"]
p1 = [8, 6, 9, 7, 8, 5]
p2 = [6, 9, 5, 8, 6, 7]
n = len(skills)

angles = np.linspace(0, 2 * np.pi, n, endpoint=False)
# Close the loop by repeating the first point
angles_closed = np.concatenate([angles, angles[:1]])
p1c = p1 + p1[:1]
p2c = p2 + p2[:1]

fig, ax = plt.subplots(subplot_kw={"projection": "polar"})
ax.plot(angles_closed, p1c, "o-", label="Player 1")
ax.fill(angles_closed, p1c, alpha=0.15)
ax.plot(angles_closed, p2c, "o-", label="Player 2")
ax.fill(angles_closed, p2c, alpha=0.15)

ax.set_xticks(angles)
ax.set_xticklabels(skills)
ax.set_theta_zero_location("N")
ax.set_title("Player Comparison")
ax.legend(loc="upper right", bbox_to_anchor=(1.3, 1.1))

plt.show()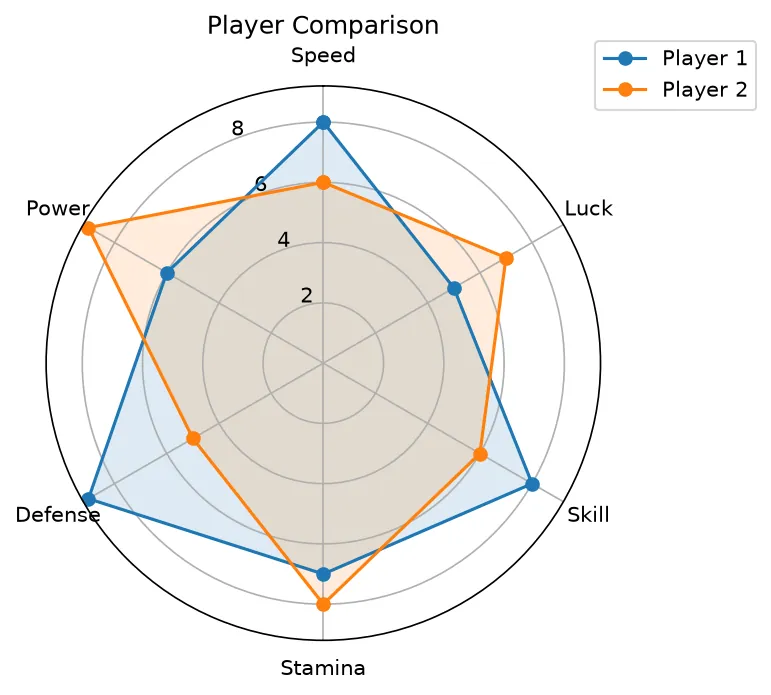
import math
import matplotlib.pyplot as plt

directions = ["N", "E", "S", "W"]
strength = [4, 7, 2, 5]

angles = [i * 2 * math.pi / len(directions) for i in range(len(directions))]
closed_angles = angles + [angles[0]]
closed_values = strength + [strength[0]]

fig, ax = plt.subplots(subplot_kw={"projection": "polar"})
ax.plot(closed_angles, closed_values)
ax.set_xticks(angles, labels=directions)

print("Projection:", ax.name)
print("Points plotted:", len(ax.lines[0].get_ydata()))
print("Closed shape:", closed_values[0] == closed_values[-1])
print("Angles in degrees:", [round(math.degrees(a)) for a in angles])
print("Tick labels:", [t.get_text() for t in ax.get_xticklabels()])
print("Strongest direction:", directions[strength.index(max(strength))])

# ✅ Expected output:
# Projection: polar
# Points plotted: 5
# Closed shape: True
# Angles in degrees: [0, 90, 180, 270]
# Tick labels: ['N', 'E', 'S', 'W']
# Strongest direction: E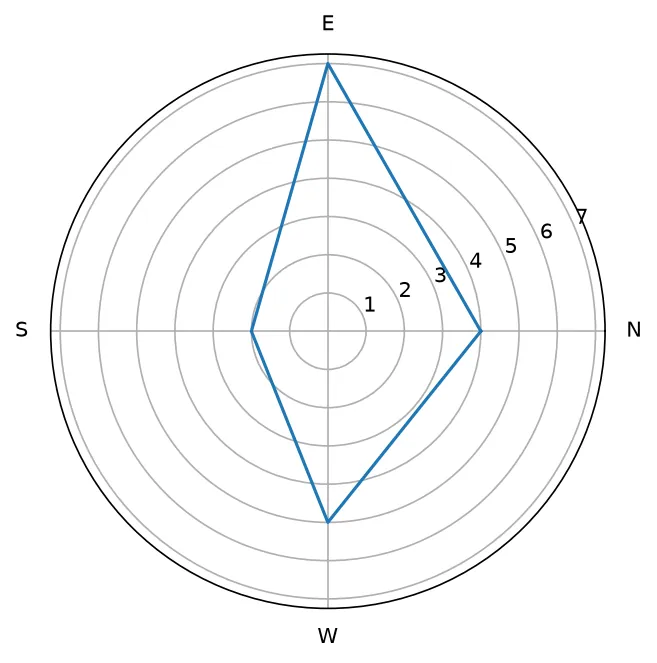
❓ Frequently Asked Questions
Lesson complete — you can plot around a circle!
You created polar axes, plotted curves with theta and r, built radar-style polar bars, and controlled the zero location, direction, and radial ticks to match real-world conventions.
Practice quiz
How do you create polar axes with plt.subplots()?
- plt.subplots(polar=True)
- plt.subplots(subplot_kw={'projection': 'polar'})
- plt.subplots(kind='polar')
- plt.subplots(mode='polar')
Answer: plt.subplots(subplot_kw={'projection': 'polar'}). Pass subplot_kw={'projection': 'polar'} to make the axes polar.
On polar axes, what is the first argument to ax.plot(theta, r)?
- The angle theta
- The radius r
- The x coordinate
- The color
Answer: The angle theta. The first argument is the angle theta (in radians), the second is the radius.
What units does Matplotlib expect for polar angles?
- Degrees
- Gradians
- Radians
- Percent
Answer: Radians. Polar angles are in radians; a full circle is 2*np.pi.
Which call moves the zero angle to the top of the plot?
- ax.set_rmax('N')
- ax.set_theta_offset('N')
- ax.set_theta_zero_location('N')
- ax.set_zero('top')
Answer: ax.set_theta_zero_location('N'). ax.set_theta_zero_location('N') puts the 0 angle at the top.
How do you make angles increase clockwise?
- ax.set_theta_direction(-1)
- ax.set_clockwise(True)
- ax.set_theta_zero_location(-1)
- ax.reverse_theta()
Answer: ax.set_theta_direction(-1). ax.set_theta_direction(-1) sweeps clockwise instead of counter-clockwise.
Why use endpoint=False in np.linspace for polar categories?
- To speed up plotting
- To stop the last angle duplicating the first
- To use degrees instead of radians
- To reverse the direction
Answer: To stop the last angle duplicating the first. endpoint=False keeps categories evenly spaced without a doubled wedge at the top.
Which method draws radar-style wedges on polar axes?
- ax.wedge()
- ax.radar()
- ax.bar()
- ax.pie()
Answer: ax.bar(). Calling ax.bar() on polar axes draws wedges fanning out from the center.
Which call sets which radial rings are labeled?
- ax.set_xticks([1, 2, 3])
- ax.set_rings([1, 2, 3])
- ax.set_radius([1, 2, 3])
- ax.set_rticks([1, 2, 3])
Answer: ax.set_rticks([1, 2, 3]). ax.set_rticks() chooses the radial tick positions.
By default, where does zero degrees point on polar axes?
- Up (north)
- Down (south)
- Left (west)
- Right (east)
Answer: Right (east). By default 0 points right and angles grow counter-clockwise.
What does ax.set_rmax() do?
- Sets the max angle
- Caps the maximum radius
- Sets the marker size
- Reverses the radius
Answer: Caps the maximum radius. ax.set_rmax() limits the largest radius shown on the plot.
Continue this course
- Previous: Stem, Step & Stair Plots
- Next: Density: hexbin & hist2d — Reveal 2D density when a scatter plot is overplotted
- Quick reference: Matplotlib cheat sheet
Frequently asked questions
How do I create a polar plot in Matplotlib?
Create the axes with a polar projection: fig, ax = plt.subplots(subplot_kw={'projection': 'polar'}). Then plot with angles in radians as the first argument and radius as the second: ax.plot(theta, r). The angle sweeps around the circle and the radius is the distance from the center.
What are theta and r in a polar plot?
theta is the angle, measured in radians, that positions a point around the circle — zero points right by default and increases counter-clockwise. r is the radius, the distance of the point from the center. Together (theta, r) replace the (x, y) you use on a normal Cartesian plot.
How do I make a radar or spider chart?
Use ax.bar() or ax.plot() on polar axes with one angle per category. Space the angles evenly with np.linspace(0, 2*pi, n, endpoint=False), give each its value as the radius, and label the angles with ax.set_xticks() and ax.set_xticklabels(). Polar bars create a radial layout that reads like a radar chart.
How do I change where zero degrees points or which way the angle increases?
Use ax.set_theta_zero_location() to move the zero angle (for example 'N' puts it at the top), and ax.set_theta_direction(-1) to make angles increase clockwise instead of counter-clockwise. These two calls let you match conventions like compass bearings or clock faces.