Complex Layouts with GridSpec
Reviewed & published by Brayan K
GridSpec is a Matplotlib tool that divides a figure into a flexible grid of rows and columns so individual subplots can span multiple cells and have different sizes.
Part of the free Matplotlib course at LearnCodingFast — hands-on lessons with worked examples and the output they print, plus practice exercises and a quick quiz.
In this lesson you'll build irregular dashboards with fig.add_gridspec(), make a panel span a whole row, control width and height ratios, and reach for subplot_mosaic as a modern shortcut.
What You'll Learn in This Lesson
- Creating a grid with fig.add_gridspec(rows, cols)
- Spanning rows and columns with slices like gs[0, :]
- Sizing panels with width_ratios and height_ratios
- Using subplot_mosaic for named, spanning panels
- Keeping labels tidy with constrained_layout
- When GridSpec beats plain plt.subplots()
1 Building a Grid and Spanning Cells
Start by asking a figure for a grid with fig.add_gridspec(rows, cols). The returned object behaves like a 2D array: index it to claim cells, then hand the slice to fig.add_subplot(). A single index like gs[0, 0] grabs one cell, while a slice like gs[1, :] grabs the entire bottom row so one wide panel can span it.
import matplotlib.pyplot as plt

# Create a figure and ask it for a 2-row, 3-column grid
fig = plt.figure(figsize=(8, 5), constrained_layout=True)
gs = fig.add_gridspec(2, 3)

# Each Axes claims one or more cells of the grid
ax1 = fig.add_subplot(gs[0, 0])   # top-left cell
ax2 = fig.add_subplot(gs[0, 1])   # top-middle cell
ax3 = fig.add_subplot(gs[0, 2])   # top-right cell
ax4 = fig.add_subplot(gs[1, :])   # whole bottom row

ax1.plot([1, 2, 3], [1, 4, 9])
ax2.bar(["a", "b", "c"], [3, 7, 2])
ax3.scatter([1, 2, 3], [2, 1, 3])
ax4.plot([0, 1, 2, 3, 4], [0, 1, 0, 1, 0])

for ax, name in zip([ax1, ax2, ax3, ax4], ["A", "B", "C", "Wide D"]):
    ax.set_title(name)

fig.suptitle("A 2x3 GridSpec Layout")
plt.show()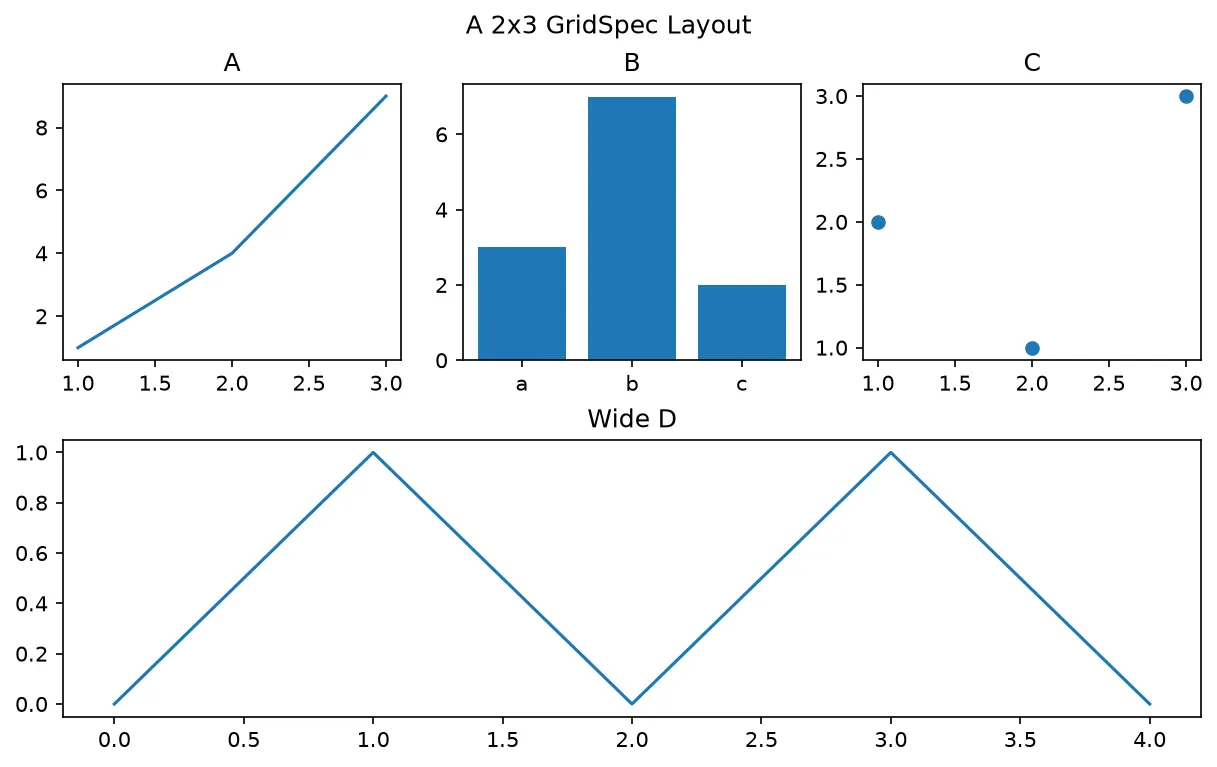
What you'll see: three equal-sized charts (a line, bars, and a scatter) across the top, and a single wide line plot stretching the full width underneath — all titled and neatly spaced by constrained_layout.
2 Width and Height Ratios
By default every row and column is equal. Pass width_ratios and height_ratios to make some bands wider or taller. The numbers are relative, so width_ratios=[2, 1] makes the first column twice as wide as the second. This is perfect for a large main chart with a slim companion panel.
import matplotlib.pyplot as plt

fig = plt.figure(figsize=(8, 5), constrained_layout=True)

# A 2x2 grid where the left column is twice as wide as the right,
# and the top row is twice as tall as the bottom row
gs = fig.add_gridspec(2, 2, width_ratios=[2, 1], height_ratios=[2, 1])

big   = fig.add_subplot(gs[0, 0])   # large top-left panel
side  = fig.add_subplot(gs[0, 1])   # narrow top-right panel
strip = fig.add_subplot(gs[1, :])   # short full-width strip

big.plot(range(10), [x**2 for x in range(10)], color="crimson")
big.set_title("Main (2:1 wide, 2:1 tall)")
side.barh(["x", "y", "z"], [4, 6, 3], color="teal")
side.set_title("Side")
strip.fill_between(range(20), [x % 5 for x in range(20)], color="goldenrod")
strip.set_title("Bottom strip")

plt.show()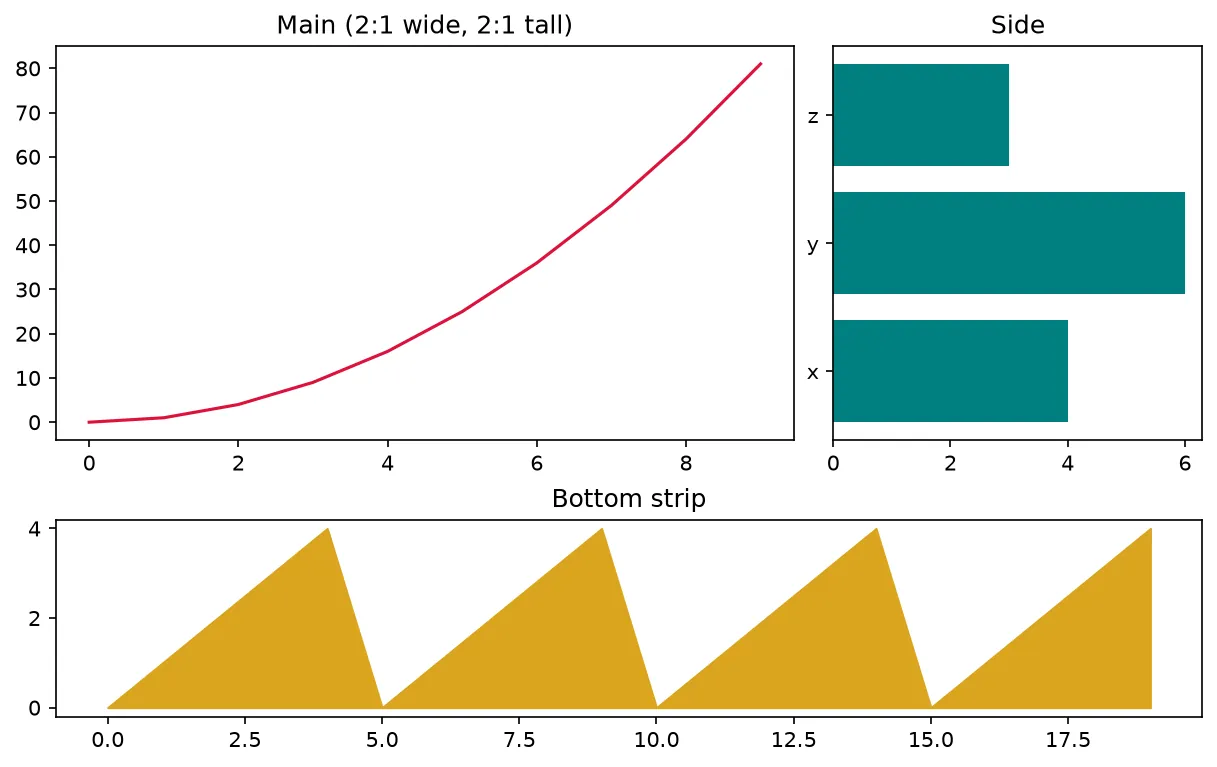
What you'll see: a large red parabola dominating the top-left, a slim teal horizontal-bar panel beside it, and a short golden filled strip running the full width along the bottom.
3 The Modern Shortcut: subplot_mosaic
Manually slicing a GridSpec works, but plt.subplot_mosaic() is far more readable. You draw the layout as an ASCII map (or a nested list) where each letter names a panel. Repeating a letter across neighboring cells merges them into one spanning Axes. You get back a dictionary of Axes keyed by those names — no index math required.
import matplotlib.pyplot as plt

# subplot_mosaic builds named panels from an ASCII "map"
fig, axd = plt.subplot_mosaic(
    """
    AB
    CC
    """,
    figsize=(7, 5),
    constrained_layout=True,
)

axd["A"].plot([1, 2, 3], [3, 1, 2])
axd["A"].set_title("Panel A")
axd["B"].pie([3, 4, 5], labels=["x", "y", "z"])
axd["B"].set_title("Panel B")
axd["C"].plot(range(10), range(10), color="purple")
axd["C"].set_title("Panel C spans the bottom")

plt.show()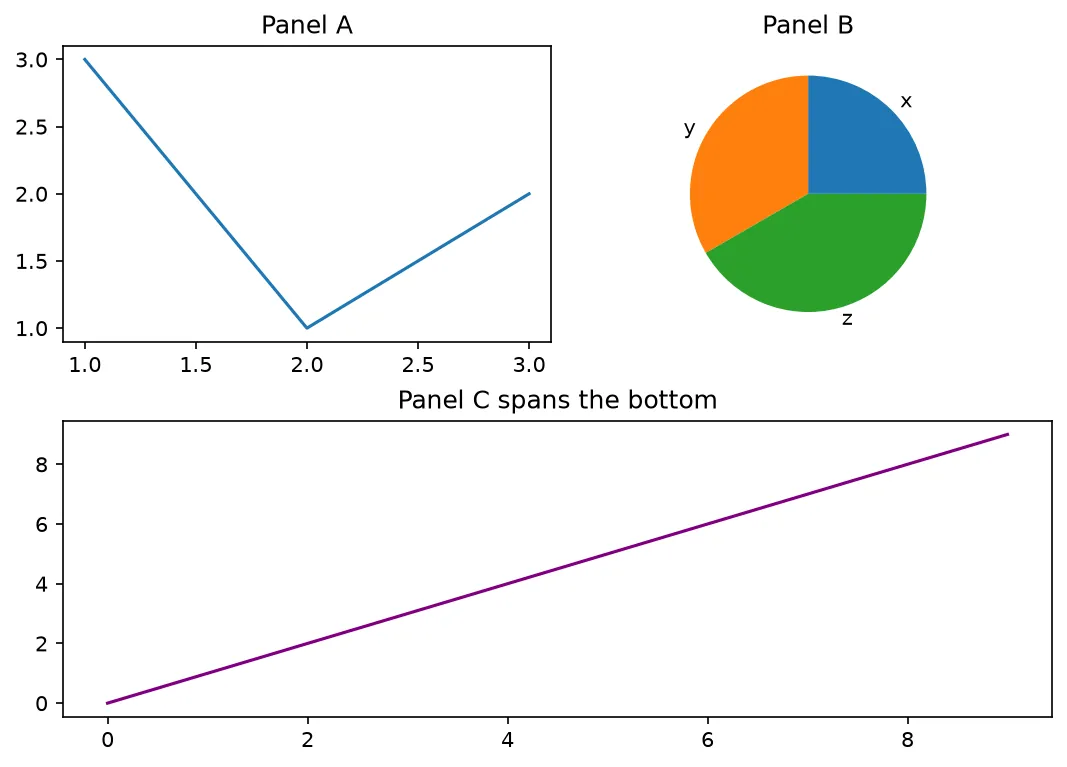
What you'll see: a line chart (A) and a pie chart (B) sharing the top row, with a single purple diagonal line (C) spanning the full width below — accessed cleanly by name.
🎯 Your Turn: Fill in the Blanks
Replace each ___ to make the top plot span the whole top row of a 2x2 grid.
import matplotlib.pyplot as plt

fig = plt.figure(figsize=(7, 5), constrained_layout=True)

# Ask for a 2-row, 2-column grid
gs = fig.add_gridspec(2, ___)

# Make this Axes span the ENTIRE top row (row 0, all columns)
top = fig.add_subplot(gs[0, ___])
bl  = fig.add_subplot(gs[1, 0])     # bottom-left cell
br  = fig.add_subplot(gs[1, 1])     # bottom-right cell

top.plot([0, 1, 2, 3], [0, 2, 1, 3])
bl.bar(["p", "q"], [5, 8])
br.scatter([1, 2, 3], [3, 1, 2])

plt.show()
Hint: the column count is 2, and a colon : means "all columns".
📋 Common Errors & Quick Reference
❌ Panels overlap or labels collide
You forgot the layout solver. Add constrained_layout=True to plt.figure() so titles and ticks don't crash into each other.
❌ IndexError: index out of range
Your slice references a row or column that the grid doesn't have. A add_gridspec(2, 3) grid only has rows 0–1 and columns 0–2.
❌ The mosaic Axes is None or missing
A letter that doesn't form a clean rectangle won't merge. Make sure repeated labels sit in a solid block, and use . for intentionally empty cells.
| Call | What It Does |
|---|---|
| fig.add_gridspec(r, c) | Create an r×c grid |
| fig.add_subplot(gs[0, :]) | Axes spanning the top row |
| width_ratios=[2, 1] | First column twice as wide |
| plt.subplot_mosaic(...) | Named panels from an ASCII map |
🏆 Mini Challenge: A Dashboard Mosaic
Build a dashboard where a tall "main" panel fills the left two columns of both rows, with two stacked panels on the right.
import matplotlib.pyplot as plt
import numpy as np

# Mini-Challenge: a "dashboard" mosaic with a tall left panel
fig, axd = plt.subplot_mosaic(
    [["main", "main", "kpi"],
     ["main", "main", "trend"]],
    figsize=(9, 5),
    constrained_layout=True,
)

x = np.linspace(0, 10, 200)
axd["main"].plot(x, np.sin(x), label="signal")
axd["main"].set_title("Main signal")
axd["main"].legend()

axd["kpi"].bar(["A", "B", "C"], [12, 19, 7], color="slateblue")
axd["kpi"].set_title("KPIs")

axd["trend"].plot(x, np.cos(x), color="green")
axd["trend"].set_title("Trend")

fig.suptitle("Mini Dashboard with subplot_mosaic")
plt.show()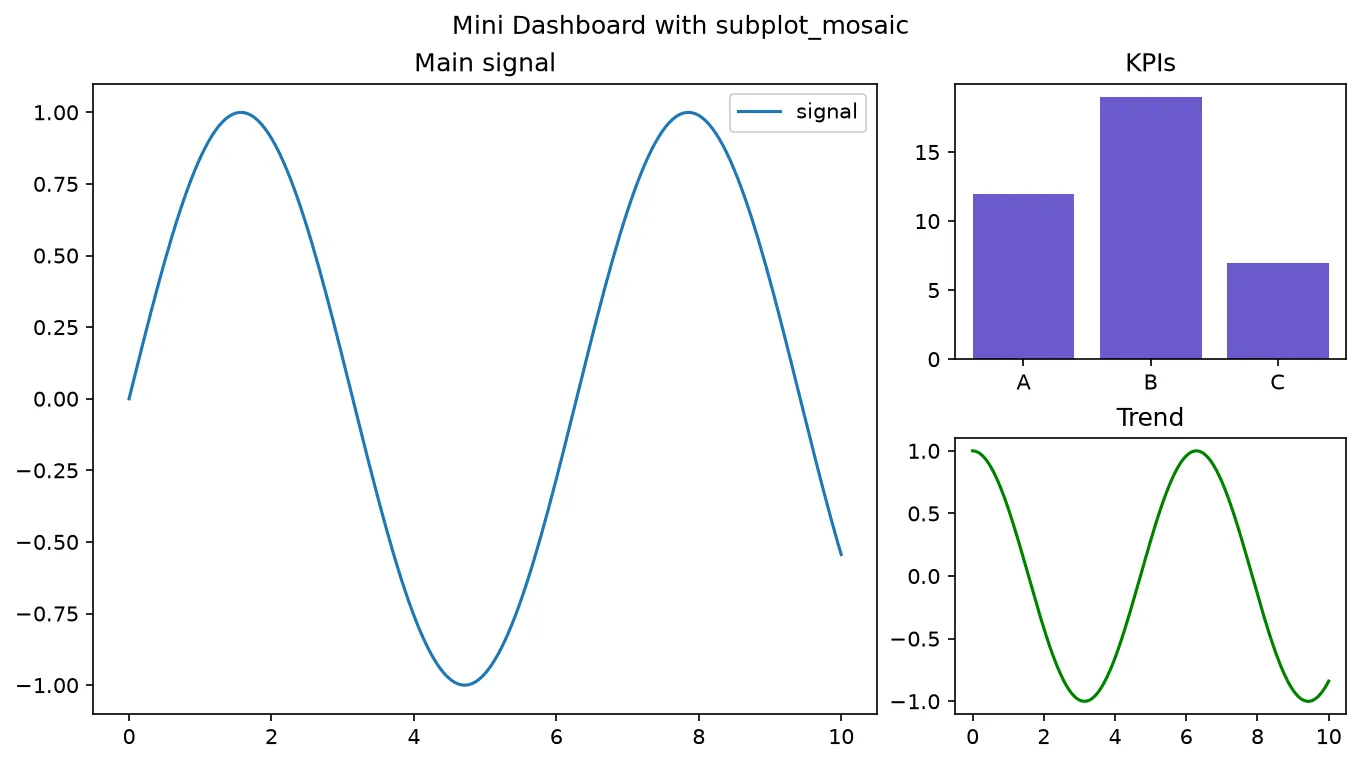
import matplotlib.pyplot as plt

fig = plt.figure(figsize=(8, 5))
gs = fig.add_gridspec(2, 3, height_ratios=[2, 1], width_ratios=[1, 1, 2])

wide = fig.add_subplot(gs[0, :])
left = fig.add_subplot(gs[1, 0])
mid = fig.add_subplot(gs[1, 1])
right = fig.add_subplot(gs[1, 2])

wide.plot([1, 2, 3], [1, 4, 9])
for a, v in ((left, 1), (mid, 2), (right, 3)):
    a.bar(["x"], [v])

print("Axes on the figure:", len(fig.axes))
print("Grid shape:", gs.get_geometry())
print("Height ratios:", gs.get_height_ratios())
print("Width ratios:", gs.get_width_ratios())
print("The top axes spans all three columns:", wide.get_subplotspec().colspan == range(0, 3))
print("The right cell is twice as wide as the left:", gs.get_width_ratios()[2] == 2 * gs.get_width_ratios()[0])

# ✅ Expected output:
# Axes on the figure: 4
# Grid shape: (2, 3)
# Height ratios: [2, 1]
# Width ratios: [1, 1, 2]
# The top axes spans all three columns: True
# The right cell is twice as wide as the left: True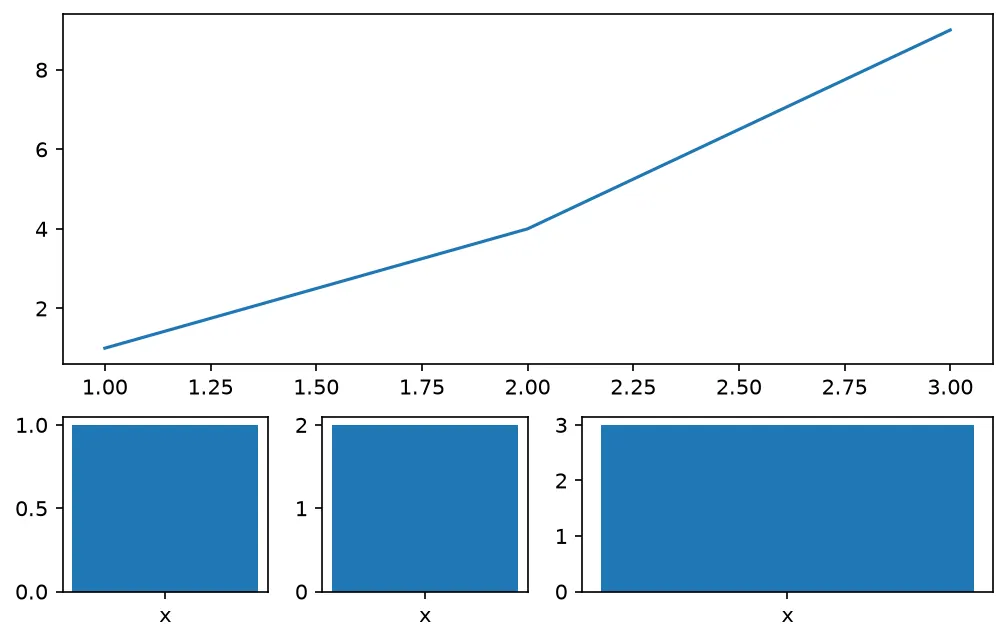
❓ Frequently Asked Questions
Lesson complete — you can design any layout you want!
You created grids with fig.add_gridspec(), made panels span rows and columns with slices, tuned sizes with width and height ratios, and built named dashboards with subplot_mosaic under constrained_layout.
Practice quiz
What advantage does GridSpec have over plain plt.subplots()?
- It is faster to render
- It allows irregular layouts where panels span cells and differ in size
- It only works in 3D
- It adds colorbars automatically
Answer: It allows irregular layouts where panels span cells and differ in size. plt.subplots() makes a uniform grid; GridSpec lets panels span cells and have different sizes.
Which call creates a 2-row, 3-column grid on a figure?
- fig.add_gridspec(2, 3)
- plt.gridspec(2, 3)
- fig.grid(2, 3)
- ax.add_gridspec(2, 3)
Answer: fig.add_gridspec(2, 3). fig.add_gridspec(rows, cols) returns a GridSpec you can slice into.
What does the slice gs[0, :] select?
- The left column
- A single top-left cell
- The entire top row
- The bottom-right block
Answer: The entire top row. gs[0, :] takes row 0 across all columns — the whole top row.
After slicing a GridSpec, how do you create the Axes?
- fig.add_subplot(gs[...])
- gs.plot()
- plt.axes(gs)
- ax.add(gs[...])
Answer: fig.add_subplot(gs[...]). Pass the GridSpec slice to fig.add_subplot() to build that Axes.
What does width_ratios=[2, 1] do?
- Makes the first column twice as wide as the second
- Makes the first column half as wide
- Sets row heights
- Sets the DPI
Answer: Makes the first column twice as wide as the second. width_ratios are relative, so [2, 1] makes the first column twice as wide.
Which argument makes the top row twice as tall as the bottom?
- row_span=2
- height_ratios=[2, 1]
- tall=True
- width_ratios=[2, 1]
Answer: height_ratios=[2, 1]. height_ratios=[2, 1] makes the first row twice as tall as the second.
What is plt.subplot_mosaic() used for?
- Saving figures
- Building named, spanning panels from an ASCII map or nested list
- 3D rendering
- Animating plots
Answer: Building named, spanning panels from an ASCII map or nested list. subplot_mosaic builds complex layouts from an ASCII map; repeated labels merge into one panel.
In a mosaic string, what does a '.' (dot) mean?
- A merged panel
- An empty cell
- A colorbar
- A title
Answer: An empty cell. A '.' leaves a cell intentionally empty in the mosaic layout.
What does subplot_mosaic return for accessing panels?
- A list of lines
- A dictionary of Axes keyed by name
- A single Axes
- A NumPy array of figures
Answer: A dictionary of Axes keyed by name. You get back a dict of Axes keyed by the labels, e.g. axd['C'].
Which option keeps titles and labels from overlapping with spanning panels?
- constrained_layout=True
- overlap=False
- tidy=True
- spacing='auto'
Answer: constrained_layout=True. constrained_layout=True runs a solver that keeps labels and titles from colliding.
Continue this course
- Previous: Checkpoint: Chart Types
- Next: Colormaps & Normalization — Choose perceptually-uniform colormaps and control value mapping
- Quick reference: Matplotlib cheat sheet
Frequently asked questions
What is the difference between plt.subplots() and GridSpec?
plt.subplots() always builds a uniform grid where every Axes is the same size. GridSpec lets you carve an irregular layout: one Axes can span several rows or columns, and rows and columns can have different widths and heights. Reach for GridSpec whenever a plain grid is too rigid.
How do I make one subplot span multiple cells?
Use slicing on the GridSpec object. gs[0, :] takes the whole top row, gs[:, 0] takes the entire left column, and gs[1:, 1:] takes a 2x2 block in the bottom-right. You pass that slice to fig.add_subplot().
What is subplot_mosaic and when should I use it?
subplot_mosaic is the modern shortcut for building complex layouts from an ASCII map or a nested list. Repeating the same label across cells merges them into one spanning Axes, and you get back a dictionary of named Axes — no manual slicing required. It is the easiest way to lay out a dashboard.
Should I use constrained_layout or tight_layout?
constrained_layout is the recommended modern option. It runs a solver that keeps titles, labels, and colorbars from overlapping even with spanning panels. Pass constrained_layout=True to plt.figure() or subplot_mosaic(). tight_layout() still works but handles GridSpec spans less gracefully.