Colormaps & Normalization
Reviewed & published by Brayan K
A colormap is a lookup table that turns numeric values into colors, and normalization is the step that decides which values map to the bottom and top of that color scale.
Part of the free Matplotlib course at LearnCodingFast — hands-on lessons with worked examples and the output they print, plus practice exercises and a quick quiz.
In this lesson you'll choose the right colormap for your data, apply it to scatter and image plots, and control the color limits with vmin, vmax, and Normalize.
What You'll Learn in This Lesson
- Applying a colormap with the cmap argument
- Sequential vs diverging vs qualitative maps
- Why viridis beats jet for honest visuals
- Coloring scatter points by a third variable
- Pinning color limits with vmin and vmax
- Reusing color scales with Normalize
1 Applying a Colormap with cmap
Whenever you have a third number to show alongside x and y, color is the natural channel. Pass that number to the c argument of plt.scatter() and name a colormap with cmap. Matplotlib stretches the chosen scale across your value range and a colorbar serves as the legend.
import matplotlib.pyplot as plt
import numpy as np

# Random points colored by a third value
rng = np.random.default_rng(0)
x = rng.random(200)
y = rng.random(200)
z = x + y   # the value that decides each point's color

# cmap maps the z values to colors from the "viridis" scale
sc = plt.scatter(x, y, c=z, cmap="viridis", s=40)
plt.colorbar(sc, label="x + y")
plt.title("Scatter colored by viridis")
plt.show()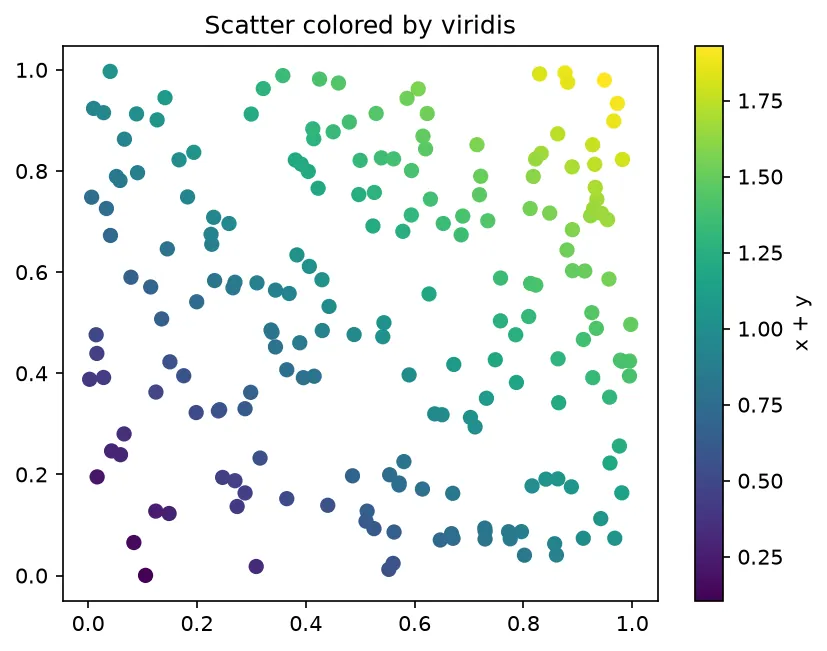
What you'll see: 200 scattered dots whose color shifts smoothly from deep purple (low x+y) through teal to bright yellow (high x+y), with a colorbar on the right translating color back into a number.
2 Three Families of Colormap
Choosing the right family matters more than choosing a pretty one. Sequential maps (viridis, plasma, Blues) suit data that runs low to high. Diverging maps (coolwarm, RdBu) have a neutral middle and two contrasting ends — perfect for values above and below a center like zero. Qualitative maps (tab10, Set2) are unordered distinct colors for categories, never for continuous data.
import matplotlib.pyplot as plt
import numpy as np

# Compare three categories of colormap on the same data
data = np.random.default_rng(1).random((10, 10))

fig, axes = plt.subplots(1, 3, figsize=(11, 4), constrained_layout=True)

for ax, cmap, kind in zip(
    axes,
    ["viridis", "coolwarm", "tab10"],
    ["Sequential", "Diverging", "Qualitative"],
):
    im = ax.imshow(data, cmap=cmap)
    ax.set_title(f"{kind}\n({cmap})")
    fig.colorbar(im, ax=ax, shrink=0.7)

plt.show()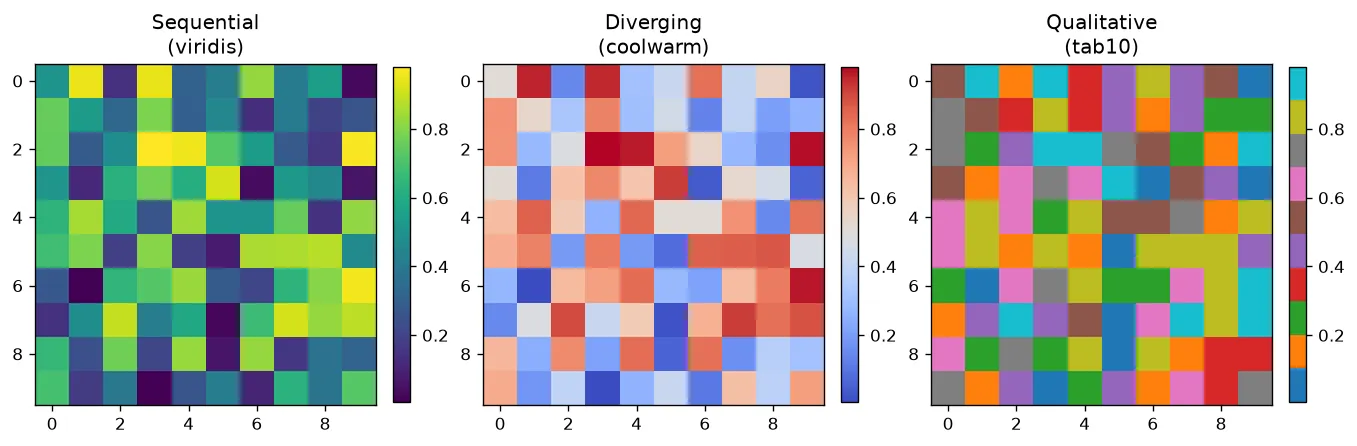
What you'll see: three 10×10 heatmaps side by side. The viridis panel reads smoothly, the coolwarm panel splits warm and cool tones around the middle, and the tab10 panel looks blocky and discontinuous — exactly why qualitative maps are wrong for continuous data.
3 Normalization: vmin, vmax & Normalize
By default the color scale auto-stretches to your data's minimum and maximum. That is convenient, but it means two plots with different ranges use the same colors for different values. Pin the limits with vmin and vmax — or build a reusable Normalize(vmin, vmax) object — so colors stay comparable across panels, frames, or dashboards.
import matplotlib.pyplot as plt
import numpy as np
from matplotlib.colors import Normalize

data = np.random.default_rng(2).normal(50, 15, (8, 8))

fig, (ax1, ax2) = plt.subplots(1, 2, figsize=(9, 4), constrained_layout=True)

# Left: automatic color limits
im1 = ax1.imshow(data, cmap="plasma")
ax1.set_title("Auto vmin/vmax")
fig.colorbar(im1, ax=ax1)

# Right: pinned color limits with Normalize
norm = Normalize(vmin=0, vmax=100)
im2 = ax2.imshow(data, cmap="plasma", norm=norm)
ax2.set_title("Fixed 0-100 (Normalize)")
fig.colorbar(im2, ax=ax2)

plt.show()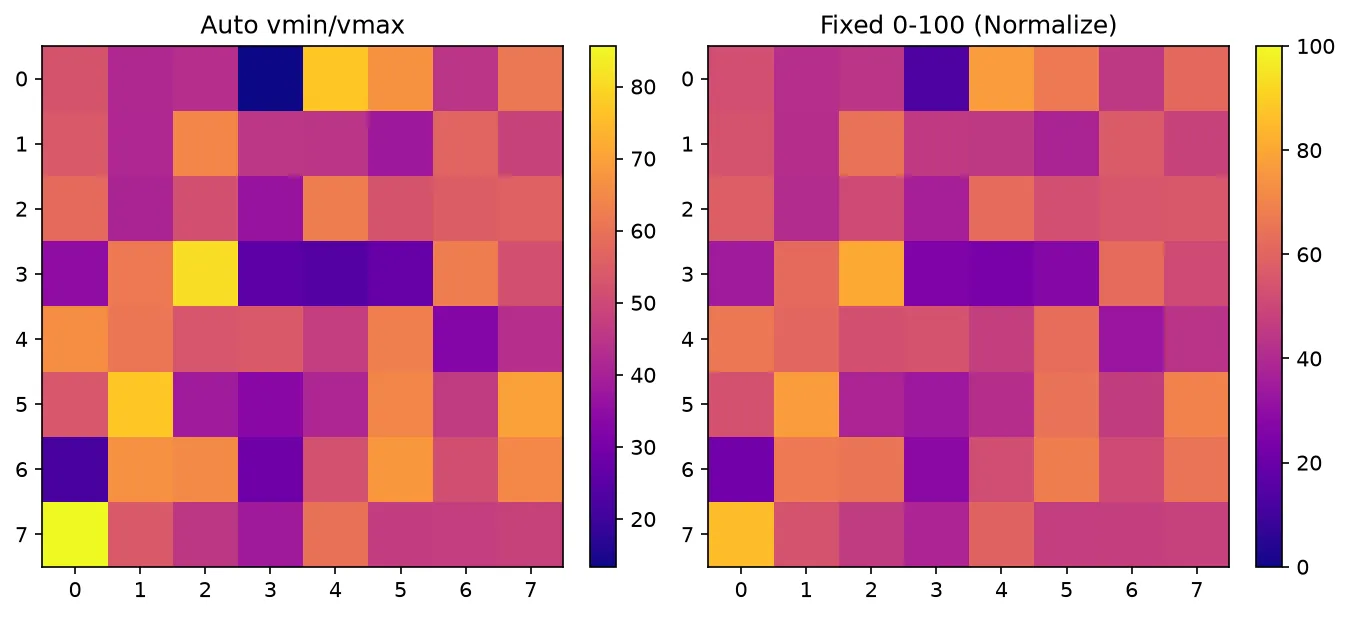
What you'll see: two heatmaps of the same data. The left one uses the full color range so contrast looks strong; the right one fixes the scale to 0–100, so the colors look muted but would stay consistent if you plotted another dataset beside it.
🎯 Your Turn: Fill in the Blanks
Replace each ___ to color points by temperature with a diverging map and add a labeled colorbar.
import matplotlib.pyplot as plt
import numpy as np

rng = np.random.default_rng(3)
x = rng.random(150)
y = rng.random(150)
temp = rng.uniform(-10, 35, 150)   # temperature readings, below and above 0

# Color the points by temp using the diverging "coolwarm" map
sc = plt.scatter(x, y, c=temp, cmap="___", s=50)

# Add a colorbar and label it
plt.___(sc, label="Temperature (C)")

plt.title("Sensor readings")
plt.show()
Hint: a diverging map suits values around zero — try coolwarm — and the legend comes from plt.colorbar.
📋 Common Errors & Quick Reference
❌ My scatter is all one color
You passed a color name to color= instead of values to c=. The colormap only kicks in when c receives an array of numbers.
A typo in the name. Colormap names are case-sensitive: it is viridis and coolwarm, not Viridis or CoolWarm.
❌ Colors look wrong across two plots
Each plot auto-scaled to its own range. Set the same vmin/vmax (or share a Normalize) on both so a value always maps to the same color.
| Choice | Use It For |
|---|---|
| cmap="viridis" | Ordered low-to-high data |
| cmap="coolwarm" | Values around a center (e.g. 0) |
| cmap="tab10" | Distinct categories |
| norm=Normalize(0, 100) | Fixed, comparable color limits |
🏆 Mini Challenge: Activity Heatmap
Draw a 12×12 heatmap with the magma colormap, lock the color scale to 0–100, and give the colorbar a clear label.
import matplotlib.pyplot as plt
import numpy as np

# A 12x12 grid of activity scores between 0 and 100
grid = np.random.default_rng(4).random((12, 12)) * 100

fig, ax = plt.subplots(figsize=(6, 5), constrained_layout=True)
im = ax.imshow(grid, cmap="magma", vmin=0, vmax=100)

ax.set_title("Activity Heatmap")
cbar = fig.colorbar(im, ax=ax)
cbar.set_label("Activity score (0-100)")

plt.show()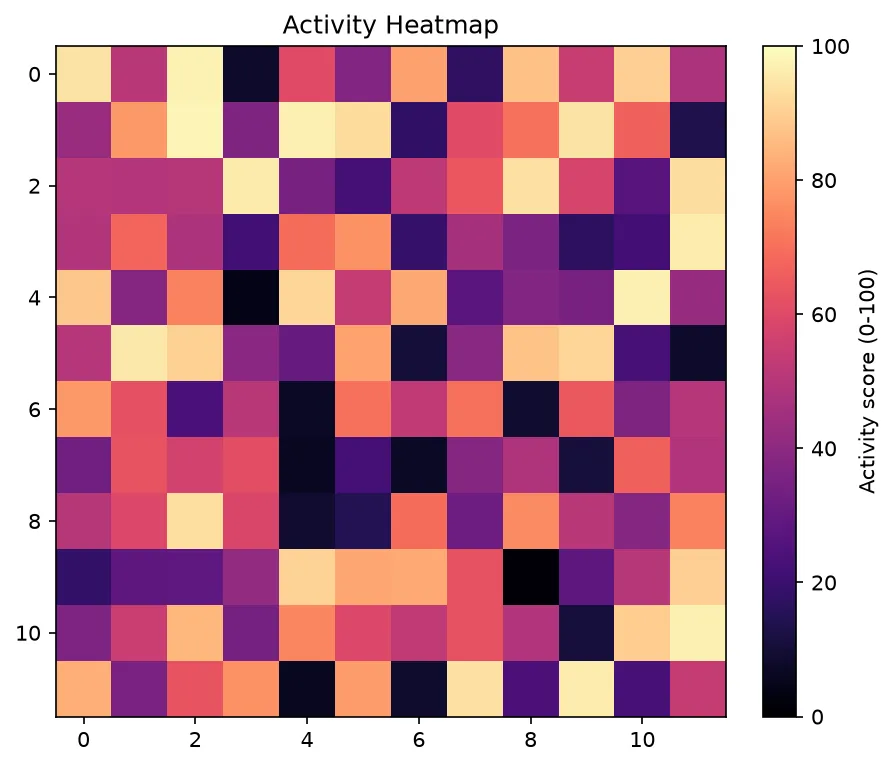
import matplotlib.pyplot as plt
from matplotlib import colormaps
from matplotlib.colors import to_hex

viridis = colormaps["viridis"]
grey = colormaps["Greys"]

print("Viridis at 0.0:", to_hex(viridis(0.0)))
print("Viridis at 1.0:", to_hex(viridis(1.0)))
print("Greys at 0.0:  ", to_hex(grey(0.0)))
print("Greys at 1.0:  ", to_hex(grey(1.0)))
print("Reversed name:", viridis.reversed().name)
print("Same colour from both ends:", to_hex(viridis(0.0)) == to_hex(viridis.reversed()(1.0)))

# ✅ Expected output:
# Viridis at 0.0: #440154
# Viridis at 1.0: #fde725
# Greys at 0.0:   #ffffff
# Greys at 1.0:   #000000
# Reversed name: viridis_r
# Same colour from both ends: True
❓ Frequently Asked Questions
Lesson complete — you can color data honestly!
You applied colormaps with cmap, learned when to pick sequential, diverging, or qualitative families, and pinned color limits with vmin, vmax, and Normalize.
Practice quiz
What is a colormap?
- A lookup table mapping numeric values to colors
- A type of legend
- A figure layout
- A list of axis ticks
Answer: A lookup table mapping numeric values to colors. A colormap converts numbers into colors across a scale.
Which argument selects the colormap on scatter or imshow?
- color
- cmap
- c
- norm
Answer: cmap. cmap names the colormap, e.g. cmap='viridis'.
Why is viridis preferred over jet (rainbow)?
- It uses fewer colors
- It is faster to render
- It is perceptually uniform and color-blind friendly
- It is the only built-in map
Answer: It is perceptually uniform and color-blind friendly. viridis is perceptually uniform and readable in grayscale and for color-blind viewers.
Which family suits values above and below a center like zero?
- Sequential
- Qualitative
- Cyclic
- Diverging (e.g. coolwarm)
Answer: Diverging (e.g. coolwarm). Diverging maps have a neutral midpoint and two contrasting ends.
Which colormap family is for unordered categories?
- Qualitative (e.g. tab10)
- Sequential
- Diverging
- Perceptual
Answer: Qualitative (e.g. tab10). Qualitative maps give distinct colors for separate categories, not continuous data.
To color scatter points by a third variable, which argument receives the values?
- color
- c
- cmap
- s
Answer: c. Pass the value array to c=; cmap then maps those numbers to colors.
What do vmin and vmax do?
- Set the figure size
- Choose the colormap
- Pin the color scale's lower and upper limits
- Add a colorbar
Answer: Pin the color scale's lower and upper limits. vmin/vmax fix the data limits the color scale spans, keeping colors comparable.
Which class makes a reusable normalization you pass as norm=?
- ColorMap
- Scale
- LogRange
- Normalize
Answer: Normalize. Normalize(vmin, vmax) is a reusable normalization object passed via norm=.
Are colormap names case-sensitive?
- Yes — it is 'viridis', not 'Viridis'
- No, case is ignored
- Only for diverging maps
- Only on Windows
Answer: Yes — it is 'viridis', not 'Viridis'. Names are case-sensitive; 'Viridis' raises an unknown-colormap error.
For data spanning many orders of magnitude, which normalization helps?
- Qualitative
- LogNorm
- tab10
- startangle
Answer: LogNorm. LogNorm from matplotlib.colors keeps small values from being crushed into one color.
Continue this course
- Previous: Complex Layouts with GridSpec
- Next: Colorbars — Add, label, and share colorbars across plots
- Quick reference: Matplotlib cheat sheet
Frequently asked questions
What is a colormap in Matplotlib?
A colormap is a lookup table that converts numeric values into colors. When you pass cmap='viridis' to a scatter or imshow plot, Matplotlib maps your smallest value to one end of the color scale and your largest value to the other end, with everything in between interpolated.
Why is viridis preferred over jet (rainbow)?
viridis is perceptually uniform: equal steps in data produce equal steps in perceived brightness, and it stays readable in grayscale and for color-blind viewers. The old jet/rainbow map has misleading bright bands that invent structure that isn't in the data, which is why it is no longer the default.
What is the difference between sequential, diverging, and qualitative colormaps?
Sequential maps (viridis, plasma) go from low to high and suit data with a natural order. Diverging maps (coolwarm, RdBu) have a neutral midpoint and two contrasting ends, ideal for values above and below a center like zero. Qualitative maps (tab10, Set2) are unordered distinct colors for categories.
How do vmin, vmax, and Normalize control colors?
By default the color scale stretches to fit your data's min and max. vmin and vmax pin those limits so colors stay comparable across plots or frames. The Normalize class does the same and can be reused; you pass norm=Normalize(vmin, vmax) to imshow or scatter.