Colorbars
Reviewed & published by Brayan K
A colorbar is the labeled strip beside a plot that acts as the legend for a colormap, translating each color back into the numeric value it represents.
Part of the free Matplotlib course at LearnCodingFast — hands-on lessons with worked examples and the output they print, plus practice exercises and a quick quiz.
In this lesson you'll attach a colorbar with fig.colorbar(), give it a label and custom ticks, change its orientation and size, and share a single bar across several subplots.
What You'll Learn in This Lesson
- Attaching a colorbar with fig.colorbar(mappable, ax=)
- Capturing the mappable from imshow or scatter
- Labeling a colorbar with set_label()
- Choosing custom ticks and orientation
- Adjusting size and gap with shrink and pad
- Sharing one colorbar across multiple subplots
1 Your First Colorbar
Color-carrying plots like imshow and scatter return a mappable — an object that knows its colormap and value range. Capture it in a variable and hand it to fig.colorbar(mappable, ax=ax). Without that mappable, Matplotlib has nothing to build the legend from.
import matplotlib.pyplot as plt
import numpy as np

data = np.random.default_rng(0).random((10, 10))

fig, ax = plt.subplots(figsize=(6, 5), constrained_layout=True)
im = ax.imshow(data, cmap="viridis")   # imshow returns a "mappable"

# Attach a colorbar to that mappable, on this Axes
cbar = fig.colorbar(im, ax=ax)
cbar.set_label("Value")

ax.set_title("Heatmap with a Colorbar")
plt.show()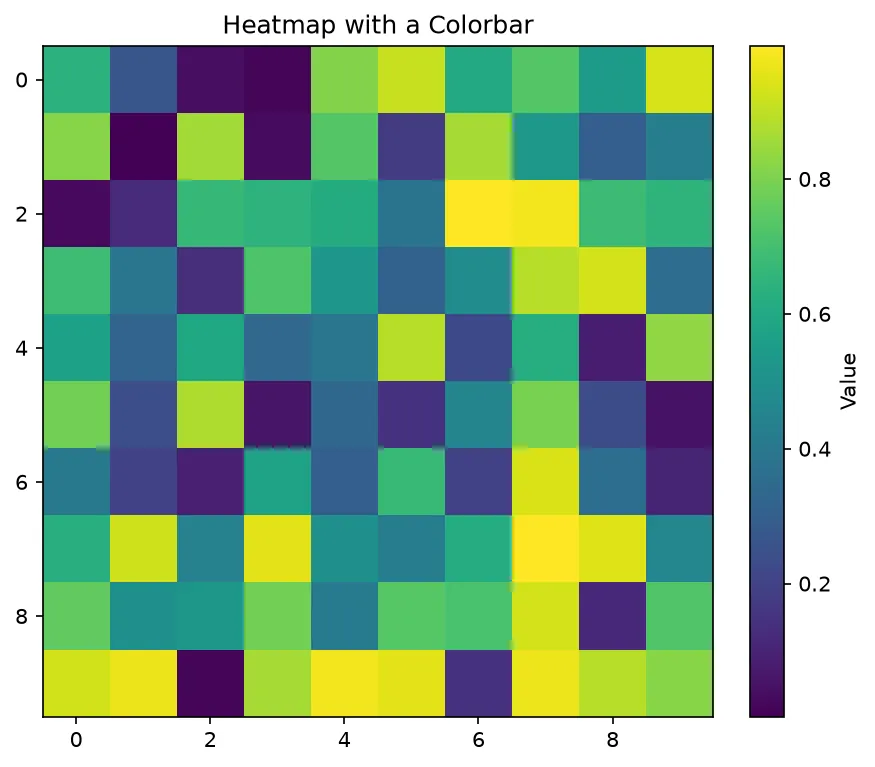
What you'll see: a 10×10 viridis heatmap with a vertical colorbar on its right edge, labeled "Value", running from dark purple at the bottom to bright yellow at the top.
2 Orientation, Ticks, Shrink & Pad
A colorbar is highly tunable. Use orientation="horizontal" to drop it below the plot, ticks=[...] to mark exactly the values you care about, shrink to scale its length, and pad to set the gap between plot and bar. Combine them to fit any layout.
import matplotlib.pyplot as plt
import numpy as np

data = np.random.default_rng(1).random((8, 8)) * 100

fig, ax = plt.subplots(figsize=(7, 4), constrained_layout=True)
im = ax.imshow(data, cmap="plasma")

# Horizontal colorbar, shrunk, with custom ticks and a label
cbar = fig.colorbar(im, ax=ax, orientation="horizontal",
                    shrink=0.8, pad=0.1, ticks=[0, 25, 50, 75, 100])
cbar.set_label("Percent")

ax.set_title("Custom Colorbar")
plt.show()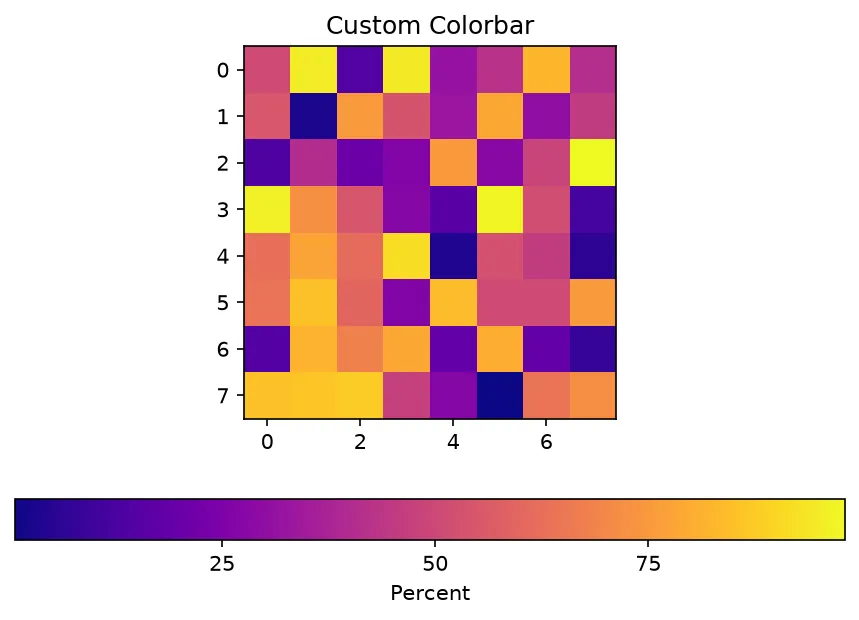
What you'll see: a plasma heatmap with a shorter, horizontal colorbar sitting below it, marked only at 0, 25, 50, 75, and 100, and labeled "Percent".
3 One Colorbar for Many Subplots
When several panels share a scale, a single colorbar is cleaner than one per panel. The key is to give every panel the same vmin and vmax so a color means the same thing everywhere, then pass a list of Axes to the ax argument.
import matplotlib.pyplot as plt
import numpy as np

# Two panels that should share ONE colorbar -> same color scale
data1 = np.random.default_rng(2).random((10, 10))
data2 = np.random.default_rng(3).random((10, 10))

fig, axes = plt.subplots(1, 2, figsize=(9, 4), constrained_layout=True)

im0 = axes[0].imshow(data1, cmap="cividis", vmin=0, vmax=1)
im1 = axes[1].imshow(data2, cmap="cividis", vmin=0, vmax=1)
axes[0].set_title("Sensor A")
axes[1].set_title("Sensor B")

# One colorbar spanning BOTH axes
cbar = fig.colorbar(im1, ax=axes, shrink=0.8)
cbar.set_label("Reading")

plt.show()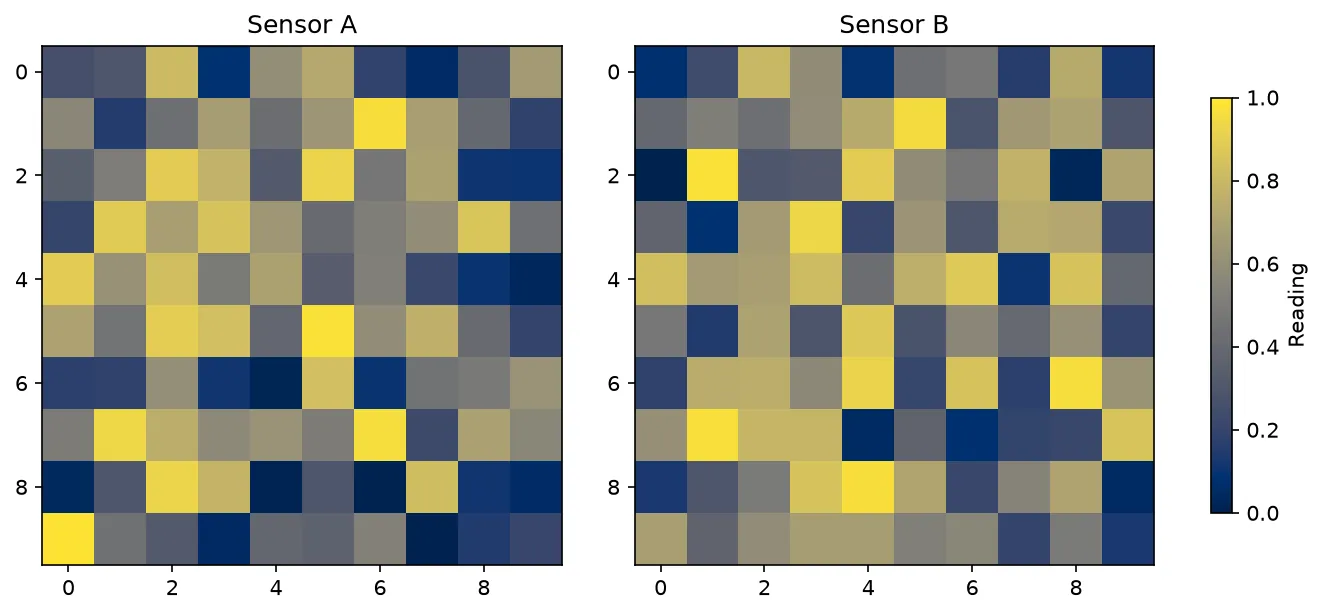
What you'll see: two cividis heatmaps side by side titled "Sensor A" and "Sensor B", with a single colorbar on the far right serving both — because both panels use the identical 0–1 scale.
🎯 Your Turn: Fill in the Blanks
Replace each ___ to add a labeled colorbar to a colored scatter plot.
import matplotlib.pyplot as plt
import numpy as np

x = np.random.default_rng(4).random(200)
y = np.random.default_rng(5).random(200)
z = x * y

fig, ax = plt.subplots(figsize=(6, 5), constrained_layout=True)
sc = ax.scatter(x, y, c=z, cmap="magma", s=40)

# Add a colorbar for the scatter's mappable (sc), on this Axes
cbar = fig.___(sc, ax=ax)

# Label the colorbar
cbar.___("x * y")

ax.set_title("Scatter")
plt.show()
Hint: the figure method is colorbar, and the label method on the returned object is set_label.
📋 Common Errors & Quick Reference
❌ RuntimeError: No mappable was found
You called fig.colorbar() without passing the plot object. Capture it first: im = ax.imshow(...), then fig.colorbar(im, ax=ax).
❌ The colorbar squashes my plot
Use constrained_layout=True and tune shrink/pad, instead of letting Matplotlib carve a large default slice out of the Axes.
❌ Shared colorbar doesn't match a panel
The panels auto-scaled differently. Give every panel the same vmin and vmax before sharing one bar.
| Call | What It Does |
|---|---|
| fig.colorbar(im, ax=ax) | Attach a colorbar |
| cbar.set_label("...") | Add a text label |
| orientation="horizontal" | Place the bar below the plot |
| ax=[ax1, ax2] | Share one bar across panels |
🏆 Mini Challenge: Temperature Grid
Draw a temperature heatmap and give it a shrunk, padded vertical colorbar with custom ticks, a label, and smaller tick text.
import matplotlib.pyplot as plt
import numpy as np

grid = np.random.default_rng(6).normal(20, 5, (12, 12))

fig, ax = plt.subplots(figsize=(6, 5), constrained_layout=True)
im = ax.imshow(grid, cmap="coolwarm")

cbar = fig.colorbar(im, ax=ax, shrink=0.75, pad=0.04,
                    ticks=[10, 15, 20, 25, 30])
cbar.set_label("Temperature (C)")
cbar.ax.tick_params(labelsize=9)

ax.set_title("Temperature Grid")
plt.show()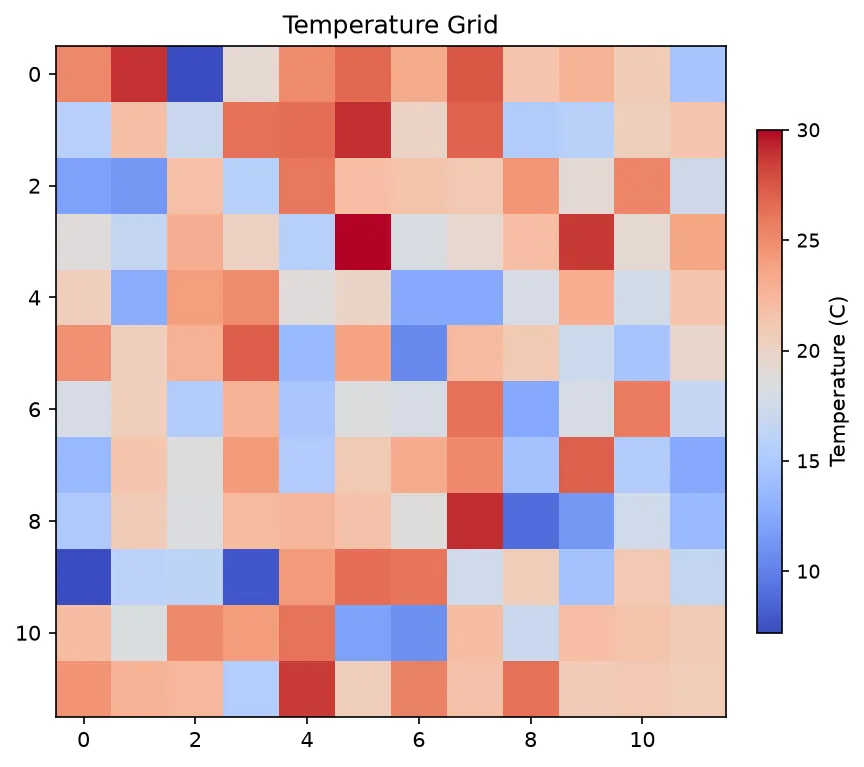
import matplotlib.pyplot as plt

grid = [[1, 2], [3, 4]]

fig, ax = plt.subplots()
im = ax.imshow(grid, cmap="plasma")
bar = fig.colorbar(im, ax=ax, label="units", shrink=0.8)

print("Axes on the figure:", len(fig.axes))
print("The colourbar has its own axes:", bar.ax is not fig.axes[0])
print("Label:", bar.ax.get_ylabel())
print("Range it covers:", [int(v) for v in im.get_clim()])
print("It follows the image's colormap:", bar.cmap.name == im.get_cmap().name)

# ✅ Expected output:
# Axes on the figure: 2
# The colourbar has its own axes: True
# Label: units
# Range it covers: [1, 4]
# It follows the image's colormap: True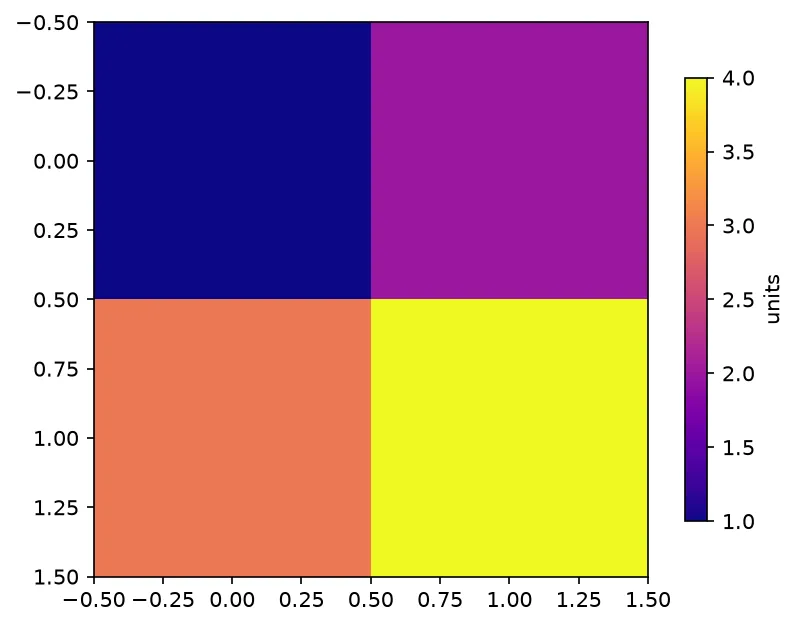
❓ Frequently Asked Questions
Lesson complete — your color scales now explain themselves!
You attached colorbars with fig.colorbar(), labeled and re-ticked them, changed orientation and size with shrink and pad, and shared a single bar across multiple panels.
Practice quiz
What is a 'mappable' that fig.colorbar() needs?
- A plot object carrying a colormap and value range
- A dictionary of ticks
- A figure title
- A list of colors
Answer: A plot object carrying a colormap and value range. A mappable (from imshow, scatter, contourf, etc.) carries the colormap and limits the colorbar reads.
Which call attaches a colorbar for a captured image im on a given Axes?
- ax.colorbar(im)
- fig.colorbar(im, ax=ax)
- plt.bar(im)
- im.colorbar(ax)
Answer: fig.colorbar(im, ax=ax). fig.colorbar(im, ax=ax) draws the colorbar and ties it to that Axes.
Which method adds a text label to the colorbar object cbar?
- cbar.title()
- cbar.text()
- cbar.set_label('Value')
- cbar.label()
Answer: cbar.set_label('Value'). cbar.set_label('Value') labels the colorbar.
Which argument places the colorbar below the plot?
- shrink=0.5
- pad=0.1
- ticks=[...]
- orientation='horizontal'
Answer: orientation='horizontal'. orientation='horizontal' drops the bar below the plot.
What does the shrink argument do to a colorbar?
- Scales its length
- Changes its color
- Moves it to the top
- Adds ticks
Answer: Scales its length. shrink scales the bar's length, e.g. shrink=0.7 makes it 70% as long.
To share one colorbar across two panels, you pass ax as:
- a single Axes
- a list of Axes, e.g. ax=[ax1, ax2]
- a string
- None
Answer: a list of Axes, e.g. ax=[ax1, ax2]. Passing a list of Axes makes one bar serve all of them.
What must match across panels for a shared colorbar to be honest?
- The figure size
- The titles
- The same vmin and vmax
- The number of ticks
Answer: The same vmin and vmax. Same vmin/vmax means a color means the same value in every panel.
Which argument chooses exactly which values get marked on the bar?
- pad
- shrink
- orientation
- ticks=[...]
Answer: ticks=[...]. ticks=[0, 25, 50, 75, 100] marks just those values.
What error appears if you call fig.colorbar() with no mappable?
- RuntimeError: No mappable was found
- ValueError: bad shape
- KeyError: cmap
- IndexError
Answer: RuntimeError: No mappable was found. You must capture and pass the plot object; otherwise there is no mappable.
Which method restyles the colorbar's tick labels?
- cbar.set_label()
- cbar.ax.tick_params()
- cbar.ticks()
- cbar.format()
Answer: cbar.ax.tick_params(). cbar.ax.tick_params(labelsize=9) adjusts the tick text on the colorbar.
Continue this course
- Previous: Colormaps & Normalization
- Next: Contour & Filled Contour Plots — Visualise 3D surfaces in 2D with contour and contourf
- Quick reference: Matplotlib cheat sheet
Frequently asked questions
What is a mappable, and why does fig.colorbar() need one?
A mappable is any plot object that carries a colormap and a value range — the thing returned by imshow, scatter, contourf, or pcolormesh. fig.colorbar() reads the colormap and limits from that object to draw the matching color scale, so you must capture and pass it: im = ax.imshow(...); fig.colorbar(im, ax=ax).
How do I add a label and custom ticks to a colorbar?
Capture the colorbar object and call its methods: cbar = fig.colorbar(im, ax=ax); cbar.set_label('Value'). Pass ticks=[...] to fig.colorbar() to choose exactly which values get marked, and use cbar.ax.tick_params() to restyle them.
How do I make a colorbar horizontal or smaller?
Pass orientation='horizontal' to place it below the plot. Use shrink to scale its length (shrink=0.7 makes it 70% as long) and pad to set the gap between the plot and the bar. These three arguments cover most layout tweaks.
How do I share one colorbar across several subplots?
Give every panel the same vmin and vmax so they use an identical scale, then pass a list of Axes to the ax argument: fig.colorbar(im, ax=[ax1, ax2]). Matplotlib steals a little room from each panel and draws a single shared bar.