Contour & Filled Contour Plots
Reviewed & published by Brayan K
A contour plot represents a 3D surface on a flat axis by drawing curves that connect points of equal height, exactly like the elevation rings on a topographic map.
Part of the free Matplotlib course at LearnCodingFast — hands-on lessons with worked examples and the output they print, plus practice exercises and a quick quiz.
In this lesson you'll build a coordinate grid with np.meshgrid, draw line and filled contours, control the levels, label curves inline with clabel, and add a colorbar.
What You'll Learn in This Lesson
- Building an X, Y grid with np.meshgrid
- Computing a height Z over that grid
- Drawing level curves with ax.contour()
- Filling bands with ax.contourf()
- Choosing how many lines with levels
- Labeling curves inline with ax.clabel()
1 The Grid: np.meshgrid
A contour needs a height value at every point on a 2D grid. np.meshgrid turns two 1D arrays of x and y coordinates into two 2D arrays, X and Y, that line up cell by cell. Compute Z from them and you have a surface ready to contour.
import matplotlib.pyplot as plt
import numpy as np

# Build a coordinate grid with meshgrid
x = np.linspace(-3, 3, 200)
y = np.linspace(-3, 3, 200)
X, Y = np.meshgrid(x, y)        # X and Y are 2D coordinate arrays

# A height value Z at every (x, y) point
Z = np.exp(-(X**2 + Y**2))

fig, ax = plt.subplots(figsize=(6, 5), constrained_layout=True)
cs = ax.contour(X, Y, Z)        # line contours
ax.set_title("Contour Lines of a Gaussian Bump")
plt.show()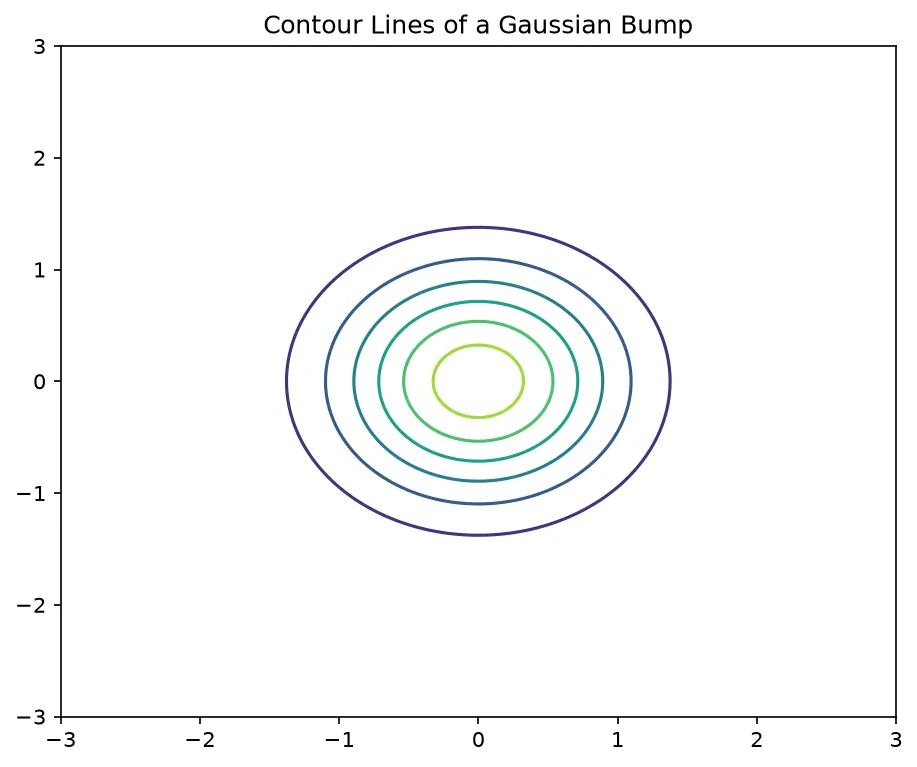
What you'll see: a set of concentric, roughly circular rings centered on the origin — the level curves of a bell-shaped bump, tightest where the surface is steepest.
2 contour vs contourf
ax.contour() draws only the level curves; ax.contourf() fills the bands between them with solid color. Filled contours read like a heatmap and pair naturally with a colorbar, while line contours stay crisp for labeling. Set how many levels appear with the levels argument.
import matplotlib.pyplot as plt
import numpy as np

x = np.linspace(-3, 3, 200)
y = np.linspace(-3, 3, 200)
X, Y = np.meshgrid(x, y)
Z = np.sin(X) * np.cos(Y)

fig, (ax1, ax2) = plt.subplots(1, 2, figsize=(10, 4), constrained_layout=True)

# Left: line contours
ax1.contour(X, Y, Z, levels=10, cmap="viridis")
ax1.set_title("contour (lines)")

# Right: filled contours + colorbar
cf = ax2.contourf(X, Y, Z, levels=20, cmap="viridis")
ax2.set_title("contourf (filled)")
fig.colorbar(cf, ax=ax2)

plt.show()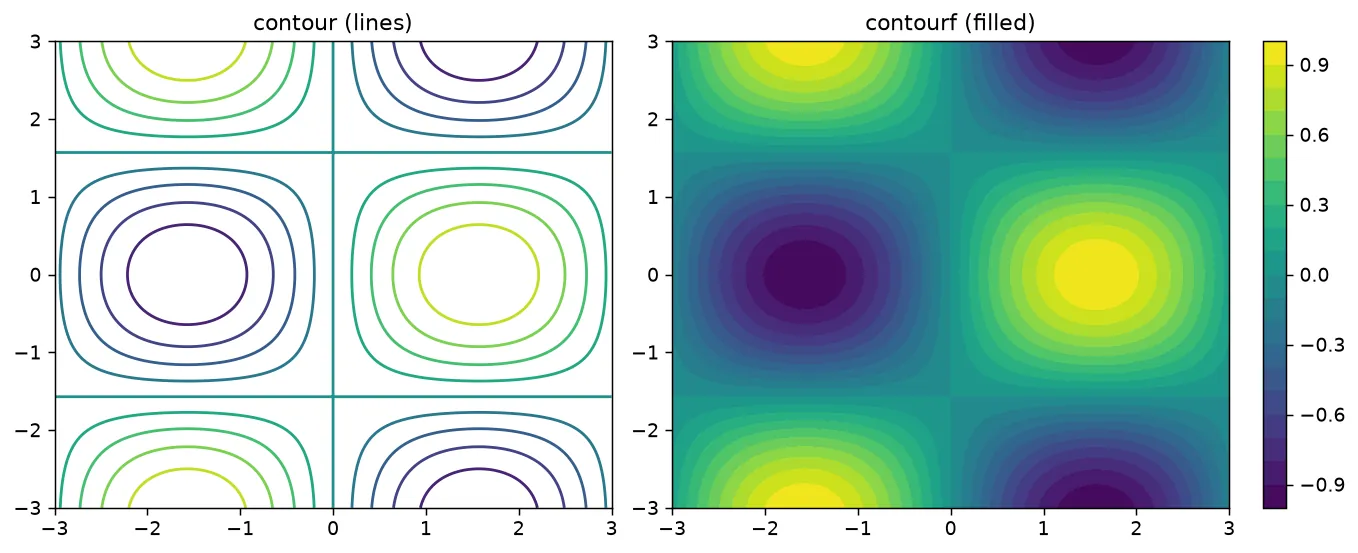
What you'll see: two panels of a wavy sine–cosine surface. The left shows just the colored level lines; the right fills the regions between them with smooth color bands and adds a colorbar.
3 Choosing Levels & Labeling with clabel
Pass a list to levels to draw curves at exactly the values you care about, then call ax.clabel() on the contour object to write each level's number directly onto its line. inline=True breaks the curve so the label sits in the gap, and fmt controls the number format.
import matplotlib.pyplot as plt
import numpy as np

x = np.linspace(-2, 2, 200)
y = np.linspace(-2, 2, 200)
X, Y = np.meshgrid(x, y)
Z = X**2 + Y**2     # a bowl

fig, ax = plt.subplots(figsize=(6, 5), constrained_layout=True)

# Choose explicit levels and label them inline
levels = [0.5, 1, 2, 4, 6]
cs = ax.contour(X, Y, Z, levels=levels, colors="black")
ax.clabel(cs, inline=True, fontsize=9, fmt="%.1f")

# A faint filled background underneath
ax.contourf(X, Y, Z, levels=30, cmap="Blues", alpha=0.6)

ax.set_title("Labeled Contours of a Bowl")
plt.show()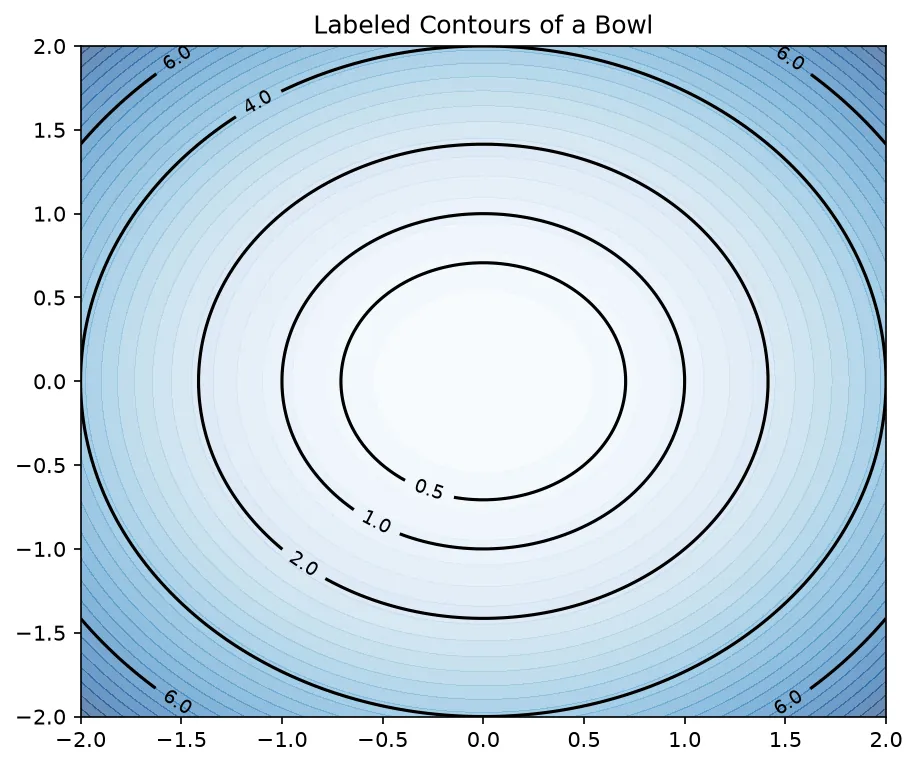
What you'll see: a bowl-shaped surface drawn as nested rings labeled 0.5, 1, 2, 4, and 6, sitting over a soft blue filled background that deepens toward the edges.
🎯 Your Turn: Fill in the Blanks
Replace each ___ to build the grid and draw a filled contour with a colorbar.
import matplotlib.pyplot as plt
import numpy as np

x = np.linspace(-3, 3, 150)
y = np.linspace(-3, 3, 150)

# Build the 2D coordinate grid
X, Y = np.___(x, y)
Z = np.cos(X) + np.sin(Y)

fig, ax = plt.subplots(figsize=(6, 5), constrained_layout=True)

# Draw FILLED contours (not just lines)
cf = ax.___(X, Y, Z, levels=15, cmap="magma")
fig.colorbar(cf, ax=ax, label="Z")

ax.set_title("Filled Contour")
plt.show()
Hint: the grid builder is meshgrid, and the filled version of contour is contourf.
📋 Common Errors & Quick Reference
❌ TypeError: Input z must be 2D
You passed a 1D array for Z. Compute it from the 2D X and Y that meshgrid returns, not from the original 1D x and y.
❌ Shapes of X, Y and Z do not match
X, Y, and Z must all share the same 2D shape. Build Z directly from X and Y so the dimensions line up.
❌ My labels don't appear
clabel needs the object returned by contour. Save it (cs = ax.contour(...)) and pass it: ax.clabel(cs, inline=True).
| Call | What It Does |
|---|---|
| np.meshgrid(x, y) | Make 2D coordinate arrays |
| ax.contour(X, Y, Z) | Draw level curves |
| ax.contourf(X, Y, Z) | Fill bands between levels |
| ax.clabel(cs) | Label curves inline |
🏆 Mini Challenge: A Topographic Map
Fill a bumpy surface with contourf and a colorbar, then overlay labeled black contour lines on top.
import matplotlib.pyplot as plt
import numpy as np

x = np.linspace(-3, 3, 250)
y = np.linspace(-3, 3, 250)
X, Y = np.meshgrid(x, y)
Z = (1 - X/2 + X**5 + Y**3) * np.exp(-(X**2 + Y**2))

fig, ax = plt.subplots(figsize=(7, 5), constrained_layout=True)

cf = ax.contourf(X, Y, Z, levels=25, cmap="RdBu_r")
cbar = fig.colorbar(cf, ax=ax)
cbar.set_label("Z value")

lines = ax.contour(X, Y, Z, levels=8, colors="black", linewidths=0.7)
ax.clabel(lines, inline=True, fontsize=8, fmt="%.2f")

ax.set_title("Filled Contours with Labeled Lines")
plt.show()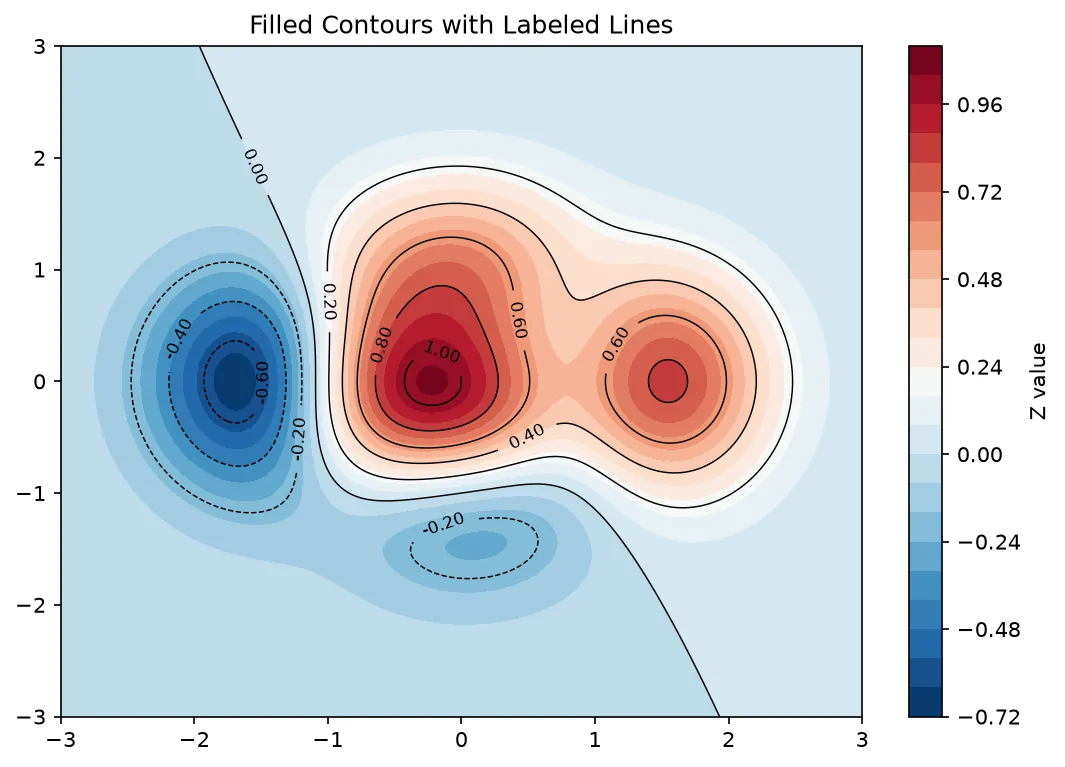
import matplotlib.pyplot as plt

xs = [0, 1, 2, 3]
ys = [0, 1, 2, 3]
grid = [[x + y for x in xs] for y in ys]

fig, ax = plt.subplots()
cs = ax.contour(xs, ys, grid, levels=[1, 3, 5])
ax.clabel(cs, inline=True, fontsize=8)

print("Levels asked for:", [float(v) for v in cs.levels])
print("Grid corner values:", grid[0][0], grid[0][-1], grid[-1][0], grid[-1][-1])
print("Every cell is x + y:", all(grid[j][i] == xs[i] + ys[j] for j in range(4) for i in range(4)))
print("Highest value on the grid:", max(max(row) for row in grid))
print("Labels were drawn:", len(ax.texts) > 0)

# ✅ Expected output:
# Levels asked for: [1.0, 3.0, 5.0]
# Grid corner values: 0 3 3 6
# Every cell is x + y: True
# Highest value on the grid: 6
# Labels were drawn: True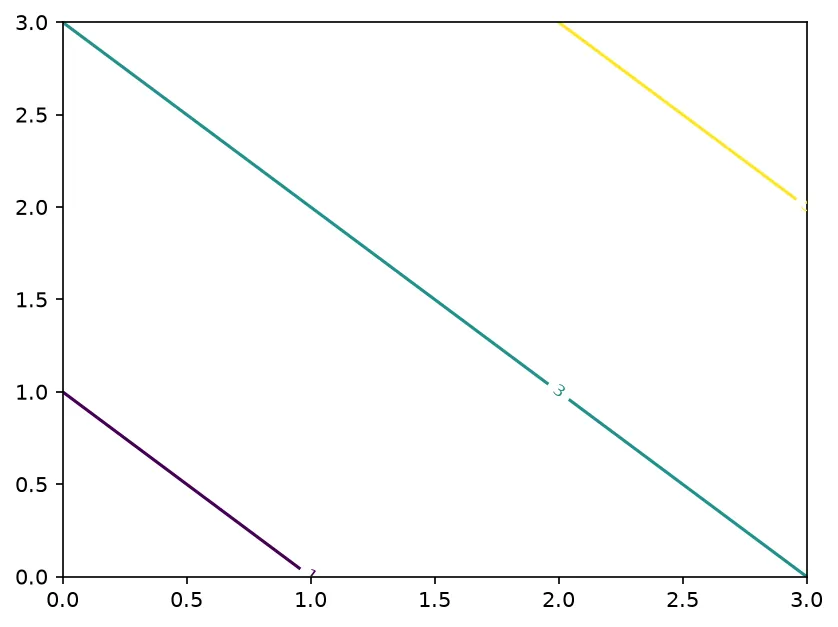
❓ Frequently Asked Questions
Lesson complete — you can map a surface onto a flat plot!
You built grids with np.meshgrid, drew level curves with contour, filled bands with contourf, chose your own levels, and labeled lines inline with clabel.
Practice quiz
What does ax.contour() draw?
- Only the level curves (lines)
- Filled color bands
- A 3D surface
- A scatter of points
Answer: Only the level curves (lines). ax.contour() draws just the level curves joining points of equal height.
What does ax.contourf() draw?
- Only thin lines
- Filled bands of solid color between levels
- A pie chart
- A bar chart
Answer: Filled bands of solid color between levels. ax.contourf() fills the regions between levels with solid color.
Why call np.meshgrid before a contour plot?
- To shuffle the data
- To set the colormap
- To expand 1D x and y into 2D coordinate arrays
- To rotate the axes
Answer: To expand 1D x and y into 2D coordinate arrays. meshgrid turns 1D x and y into 2D X and Y so every grid point has coordinates.
From which arrays should you compute Z?
- The original 1D x and y
- A random array
- The figure object
- The 2D X and Y from meshgrid
Answer: The 2D X and Y from meshgrid. Z must be 2D, computed from the X and Y that meshgrid returns.
What does levels=20 request?
- Roughly 20 evenly spaced contour levels
- Exactly 20 colors
- 20 figures
- A 20-inch figure
Answer: Roughly 20 evenly spaced contour levels. An integer asks Matplotlib for about that many evenly spaced levels.
How do you draw lines at exactly the values 0.5, 1, 2, 4?
- levels=4
- levels=[0.5, 1, 2, 4]
- ticks=[0.5,1,2,4]
- fmt='%.1f'
Answer: levels=[0.5, 1, 2, 4]. Passing a list to levels draws curves at exactly those values.
Which method labels contour lines with their values?
- ax.legend()
- ax.set_label()
- ax.clabel(cs)
- ax.text()
Answer: ax.clabel(cs). ax.clabel(cs, ...) writes each level's number onto its line.
What does inline=True do in ax.clabel()?
- Fills the contours
- Adds a colorbar
- Rotates the figure
- Breaks each line so the number sits in the gap
Answer: Breaks each line so the number sits in the gap. inline=True breaks the curve so the label fits cleanly inline.
What error appears if Z is 1D?
- TypeError: Input z must be 2D
- ValueError: bad color
- KeyError: levels
- RuntimeError: no mappable
Answer: TypeError: Input z must be 2D. contour needs a 2D Z; a 1D array raises 'Input z must be 2D'.
To add a colorbar to a filled contour, you pass which object to fig.colorbar()?
- The X grid
- The object returned by contourf()
- The 1D y array
- The figure title
Answer: The object returned by contourf(). Capture cf = ax.contourf(...) and call fig.colorbar(cf, ax=ax).
Continue this course
- Previous: Colorbars
- Next: Displaying Images & Matrices (imshow) — Render arrays and images with imshow, extent, and interpolation
- Quick reference: Matplotlib cheat sheet
Frequently asked questions
What is the difference between contour and contourf?
ax.contour() draws only the level curves — thin lines joining points of equal height, like the rings on a topographic map. ax.contourf() fills the bands between those levels with solid color. They are often layered: a filled contourf for the color background plus a contour on top for crisp labeled lines.
Why do I need np.meshgrid before plotting a contour?
A contour needs a Z value at every point on a 2D grid. np.meshgrid takes your 1D x and y arrays and expands them into two 2D coordinate arrays, X and Y, that line up cell by cell. You then compute Z from X and Y so every grid point has a height.
How do I control how many contour lines appear?
Pass the levels argument. An integer like levels=20 asks Matplotlib for roughly that many evenly spaced levels, while a list like levels=[0.5, 1, 2, 4] draws lines at exactly those values — handy for highlighting specific thresholds.
How do I label the contour lines with their values?
Capture the object returned by ax.contour() and pass it to ax.clabel(). For example cs = ax.contour(...); ax.clabel(cs, inline=True, fmt='%.1f'). inline=True breaks each line so the number sits cleanly in the gap, and fmt controls the number format.