Data Visualization with Matplotlib
Reviewed & published by Brayan K
Matplotlib is Python's most established plotting library. With a handful of pyplot calls you can turn raw numbers into line charts, scatter plots, bar charts, and histograms — and the object-oriented API gives you full control over every figure and axes.
Part of the free Python course at LearnCodingFast — hands-on lessons with examples you run in your browser, plus practice exercises and a quick quiz.
What You'll Learn in This Lesson
- • The pyplot interface: plot, scatter, bar, hist
- • Adding labels, titles, and legends
- • Figures, axes, and multi-panel subplots
- • Styling colors, markers, and line styles
- • Saving figures with savefig
- • The object-oriented fig, ax = plt.subplots() API vs the pyplot state machine
📈 1. Your First Plot
import matplotlib.pyplot as plt

x = [1, 2, 3, 4]
y = [1, 4, 9, 16]

plt.plot(x, y)
plt.xlabel("x")
plt.ylabel("y = x squared")
plt.title("My First Plot")
plt.show()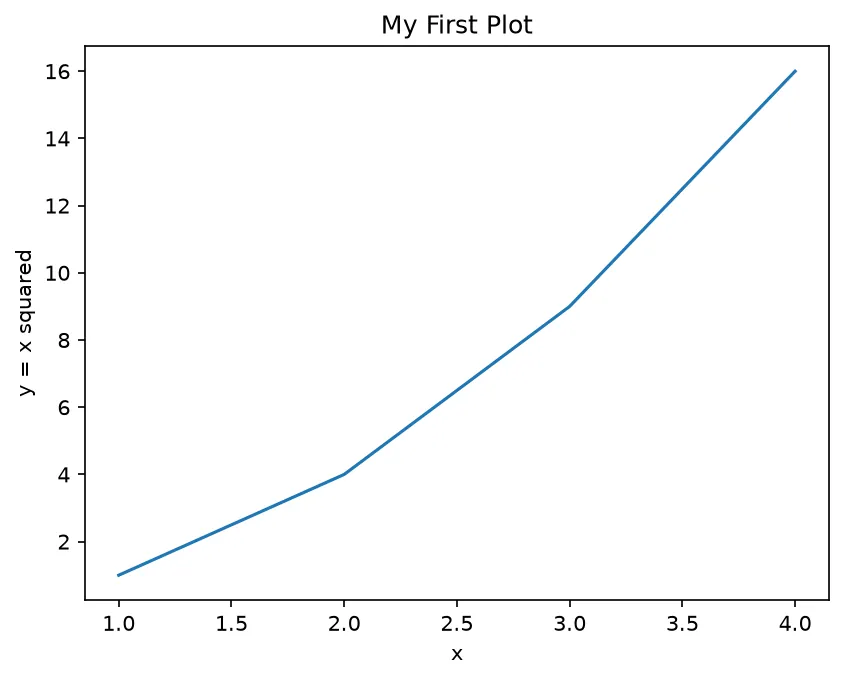
⚠️ Requires pip install matplotlib and a local Python display
🔵 2. Scatter, Bar, and Histogram
Different data calls for different chart types:
import matplotlib.pyplot as plt

# Scatter: relationship between two variables
plt.scatter([1, 2, 3], [3, 1, 2])
plt.show()

# Bar: compare categories
plt.bar(["A", "B", "C"], [5, 7, 3])
plt.show()

# Histogram: distribution of one dataset
plt.hist([1, 1, 2, 3, 3, 3, 4], bins=4)
plt.show()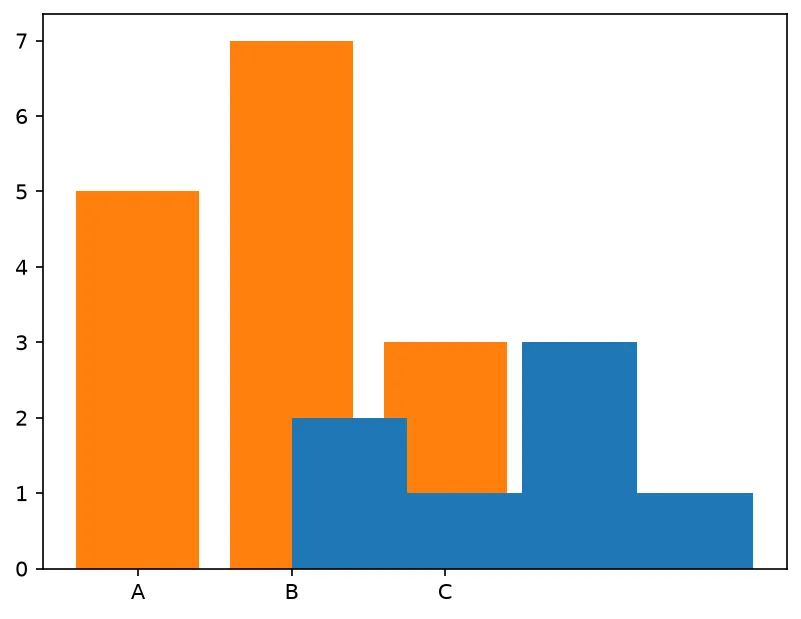
| Function | Best for |
|---|---|
| plt.plot | Trends over an ordered axis |
| plt.scatter | Relationship between two variables |
| plt.bar | Comparing categories |
| plt.hist | Distribution of one dataset |
🏷️ 3. Labels, Titles, and Legends
Annotate plots with the label= argument plus legend():
import matplotlib.pyplot as plt

plt.plot([1, 2, 3], [1, 2, 3], label="growth")
plt.plot([1, 2, 3], [3, 2, 1], label="decline")
plt.title("Two Trends")
plt.xlabel("time")
plt.ylabel("value")
plt.legend()   # shows the labels
plt.show()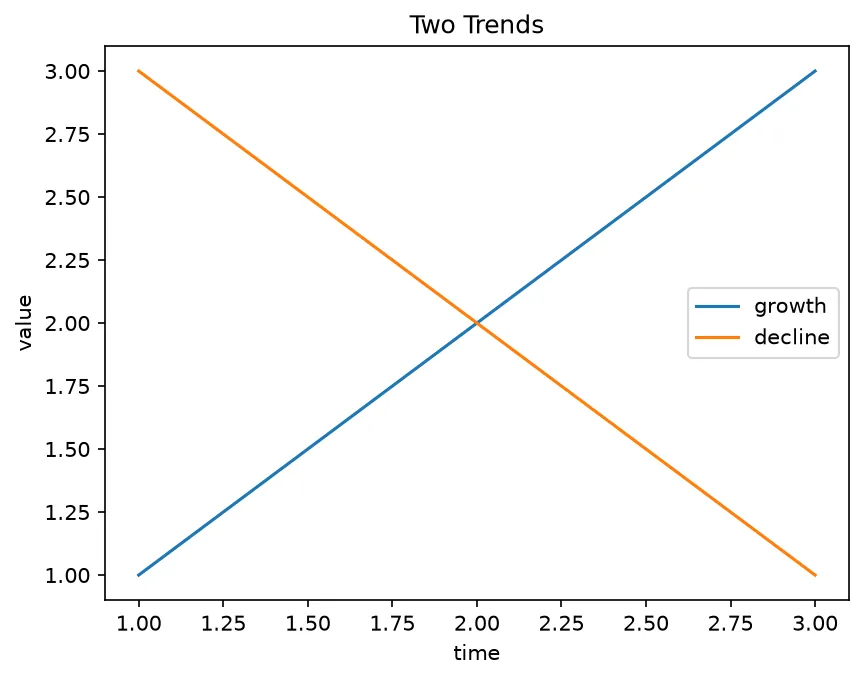
🧩 4. The Object-Oriented API
Create explicit Figure and Axes objects with plt.subplots():
import matplotlib.pyplot as plt

fig, ax = plt.subplots()
ax.plot([1, 2, 3], [2, 4, 6])
ax.set_title("OO API")
ax.set_xlabel("x")
ax.set_ylabel("y")
plt.show()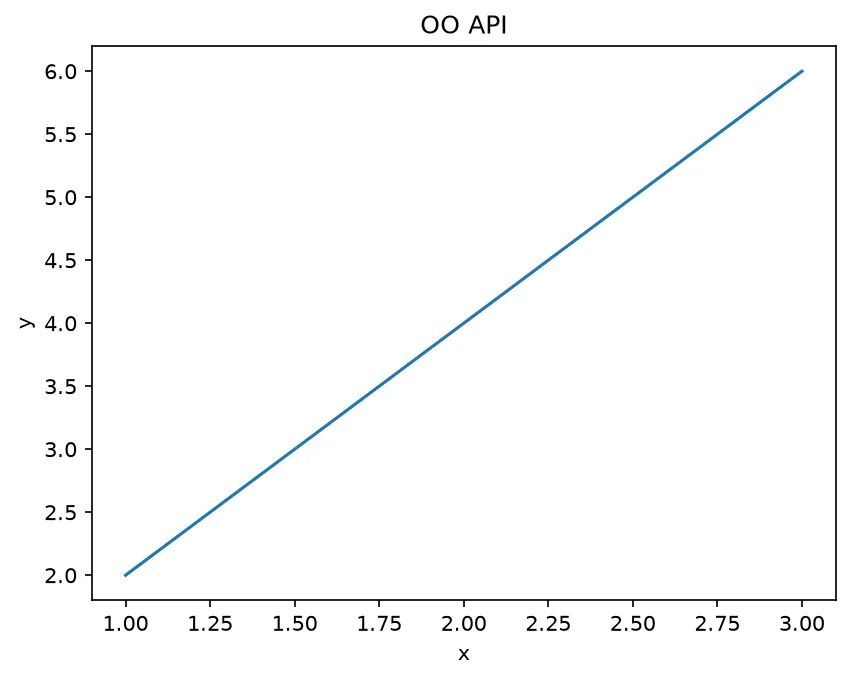
This is the recommended style for anything beyond a quick one-off chart.
🟢 Worked Example: a chart you can check without seeing it
# 🟢 WORKED EXAMPLE — build a two-line chart, save it, and prove what it contains
import matplotlib
matplotlib.use("Agg")          # "Agg" = draw into a file, never try to open a window
import matplotlib.pyplot as plt
from pathlib import Path

months  = ["Jan", "Feb", "Mar", "Apr", "May"]
signups = [120, 150, 145, 190, 240]
cancels = [10, 12, 30, 18, 22]

# One figure, one axes. figsize is in inches: 8 wide by 4.5 tall.
fig, ax = plt.subplots(figsize=(8, 4.5))

# Each ax.plot() call adds one line to the SAME axes. label= is what the legend reads.
ax.plot(months, signups, marker="o", label="sign-ups")
ax.plot(months, cancels, marker="s", linestyle="--", label="cancellations")

ax.set_title("Sign-ups vs cancellations")   # OO API: set_title, not plt.title
ax.set_xlabel("Month")
ax.set_ylabel("People")
ax.legend()                    # without this call the label= values are never shown
ax.grid(True, alpha=0.3)       # alpha=0.3 keeps the grid faint behind the data

fig.tight_layout()             # stops the labels being clipped at the edges
fig.savefig("signups.png", dpi=120)     # the extension picks the format: .png, .pdf, .svg

# ---- proof it worked, in text, because this editor only shows printed output ----
print("lines drawn   :", len(ax.lines))
print("legend labels :", [t.get_text() for t in ax.get_legend().get_texts()])
print("title         :", ax.get_title())
print("axis labels   :", ax.get_xlabel(), "/", ax.get_ylabel())
print("x tick labels :", [t.get_text() for t in ax.get_xticklabels()])
print("net growth    :", [s - c for s, c in zip(signups, cancels)])
print("file written  :", Path("signups.png").exists())

# ✅ Expected output:
# lines drawn   : 2
# legend labels : ['sign-ups', 'cancellations']
# title         : Sign-ups vs cancellations
# axis labels   : Month / People
# x tick labels : ['Jan', 'Feb', 'Mar', 'Apr', 'May']
# net growth    : [110, 138, 115, 172, 218]
# file written  : True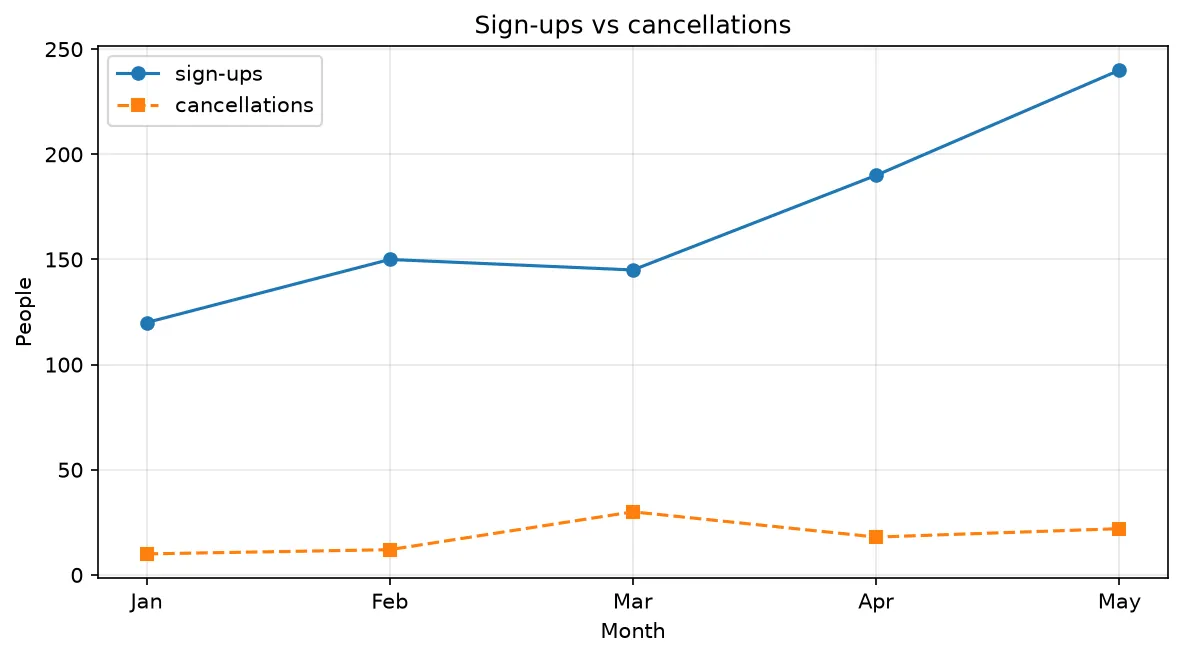
Everything you drew is still queryable afterwards — ax.lines, ax.get_title(), the legend's texts. A chart is not a picture until you save it; until then it is a Python object you can inspect, tweak and test. That is exactly how you would write an automated test for a plotting function.
🎯 Your Turn: chart a poll result
Three blanks: pick the right chart type for categories, set a title, and label the axis. Use exactly the strings shown in the hints so your output matches the expected output.
# 🎯 YOUR TURN — fill in the blanks marked with ___
import matplotlib
matplotlib.use("Agg")
import matplotlib.pyplot as plt

languages = ["Python", "JS", "Go", "Rust"]
votes     = [42, 35, 12, 18]

fig, ax = plt.subplots(figsize=(6, 4))

# 1) You are comparing four separate categories, not a trend over time.
ax.___(languages, votes, color="steelblue")   # 👉 plot, scatter, bar or hist?

# 2) Give it a title. On an Axes the method is set_something.
ax.___("Favourite language poll")             # 👉 which Axes method sets the title?

# 3) Say what the height of a bar means.
ax.set_ylabel(___)                            # 👉 the text "Votes", quotes included

fig.tight_layout()
fig.savefig("poll.png", dpi=120)

# ---- printed check ----
print("container type:", type(ax.containers[0]).__name__)
print("bars drawn    :", len(ax.containers[0]))
print("title         :", ax.get_title())
print("y label       :", ax.get_ylabel())
print("tallest bar   :", languages[votes.index(max(votes))], max(votes))

# ✅ Expected output:
# container type: BarContainer
# bars drawn    : 4
# title         : Favourite language poll
# y label       : Votes
# tallest bar   : Python 42
If blank 1 goes wrong you will see it immediately: ax.containers is empty for a line chart, so the first print raises IndexError: list index out of range instead of printing BarContainer.
🪟 5. Multiple Subplots
Pass nrows and ncols to get a grid of axes:
import matplotlib.pyplot as plt

fig, axes = plt.subplots(nrows=1, ncols=2)
axes[0].plot([1, 2, 3], [1, 2, 3])
axes[0].set_title("Left")
axes[1].bar(["A", "B"], [3, 5])
axes[1].set_title("Right")
fig.tight_layout()
plt.show()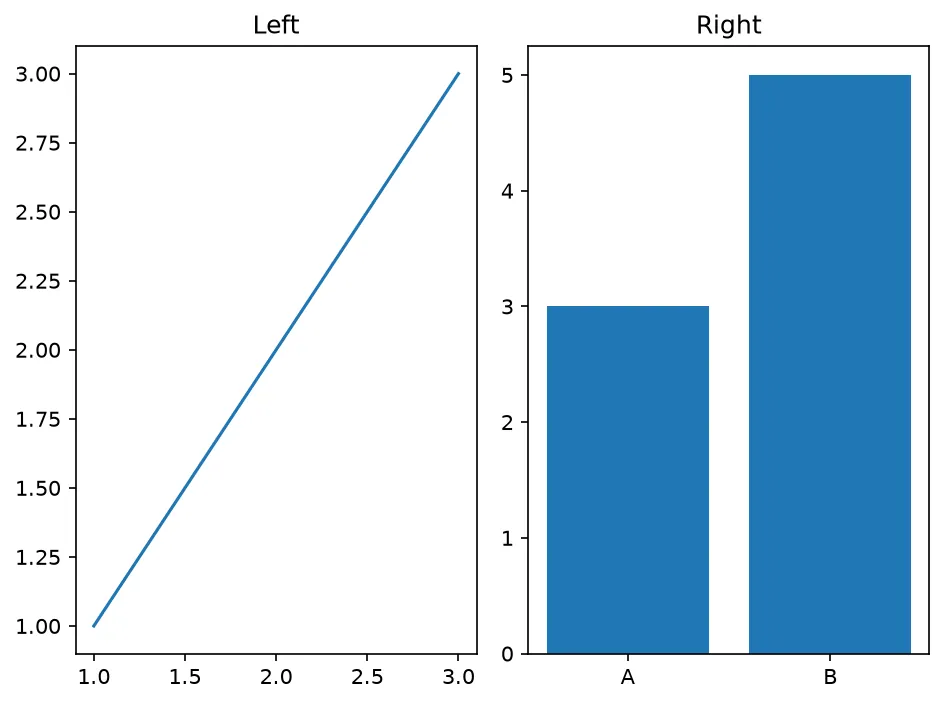
axes is an array you index into; each entry is its own Axes you draw on.
🎨 6. Styling
Control color, marker, and line style:
import matplotlib.pyplot as plt

plt.plot(
    [1, 2, 3], [1, 4, 9],
    color="green",
    linestyle="--",
    marker="o",
    linewidth=2,
)
plt.grid(True)
plt.show()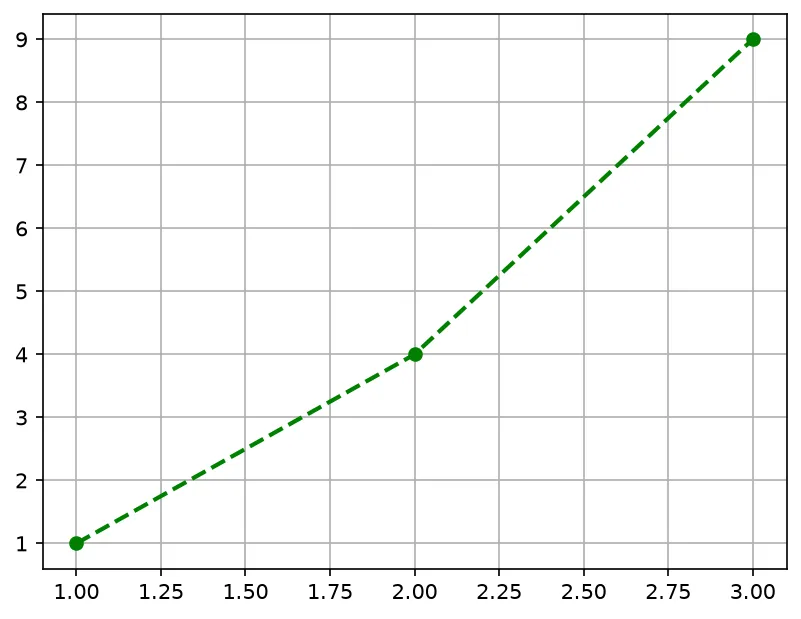
💾 7. Saving Figures
Write the figure to a file with savefig:
import matplotlib.pyplot as plt

plt.plot([1, 2, 3], [1, 2, 3])
plt.title("Saved Chart")

# Format is chosen from the file extension
plt.savefig("chart.png", dpi=150, bbox_inches="tight")
# also works: chart.pdf, chart.svg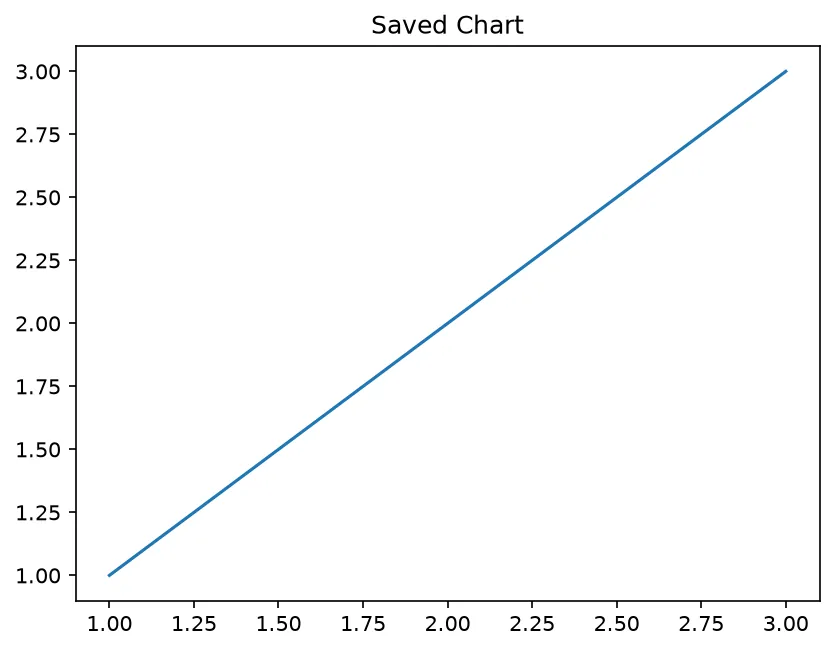
Call savefig before show() — showing can clear the current figure in some backends.
🏁 Mini-Challenge: a two-panel weather figure
No blanks — a brief and an empty outline. Build one figure with two panels side by side: a line chart of temperature on the left, a bar chart of rainfall on the right, each with its own title and y-axis label. Save it as week.png.
Use the exact titles "Temperature" and "Rainfall" so the printed check matches the expected output below.
# 🏁 MINI-CHALLENGE — write it yourself
import matplotlib
matplotlib.use("Agg")
import matplotlib.pyplot as plt
from pathlib import Path

days        = ["Mon", "Tue", "Wed", "Thu", "Fri"]
temperature = [12, 14, 13, 17, 19]
rainfall    = [4, 0, 9, 2, 0]

# 1. fig, axes = plt.subplots(nrows=1, ncols=2, figsize=(10, 4))
#    axes is an ARRAY: axes[0] is the left panel, axes[1] is the right one.
# 2. Left panel: a line of temperature against days, marker="o",
#    title "Temperature", y label "degrees C".
# 3. Right panel: bars of rainfall against days,
#    title "Rainfall", y label "mm".
# 4. fig.tight_layout(), then save the figure as week.png at dpi=120.

# your code here


# ---- printed check: leave this at the bottom ----
print("panels       :", len(fig.axes))
print("left title   :", fig.axes[0].get_title())
print("right title  :", fig.axes[1].get_title())
print("left lines   :", len(fig.axes[0].lines))
print("right bars   :", len(fig.axes[1].containers[0]))
print("warmest day  :", days[temperature.index(max(temperature))])
print("file written :", Path("week.png").exists())

# ✅ Expected output:
# panels       : 2
# left title   : Temperature
# right title  : Rainfall
# left lines   : 1
# right bars   : 5
# warmest day  : Fri
# file written : True
🎉 Conclusion
With Matplotlib you can:
✔ Draw line, scatter, bar, and histogram charts
✔ Annotate with labels, titles, and legends
✔ Build multi-panel figures with subplots
✔ Style colors, markers, and grids
✔ Save publication-ready images with savefig
Reach for the fig, ax API whenever a plot grows beyond a quick sketch.
📋 Quick Reference — Matplotlib
| Syntax | What it does |
|---|---|
| plt.plot(x, y) | Line chart |
| plt.hist(data, bins=10) | Distribution histogram |
| fig, ax = plt.subplots() | Object-oriented figure/axes |
| ax.set_title('T') | Set title on an axes |
| plt.savefig('chart.png') | Export figure to a file |
🎉 Great work! You've completed this lesson.
You can now turn data into clear, styled charts and export them for reports.
Practice quiz
Which Matplotlib module provides the familiar plot, scatter, and bar functions?
- matplotlib.pyplot
- matplotlib.axes
- matplotlib.style
- matplotlib.figure
Answer: matplotlib.pyplot. matplotlib.pyplot (conventionally imported as plt) is the high-level plotting interface.
What is the conventional import for pyplot?
- import pyplot as plt
- from matplotlib import plot as plt
- import matplotlib.pyplot as plt
- import matplotlib as plt
Answer: import matplotlib.pyplot as plt. The community convention is 'import matplotlib.pyplot as plt'.
Which function draws a line chart connecting x,y points?
- plt.scatter(x, y)
- plt.plot(x, y)
- plt.bar(x, y)
- plt.hist(x)
Answer: plt.plot(x, y). plt.plot draws a line connecting the points; scatter draws unconnected markers.
Which function is best for showing the distribution of a single dataset?
- plt.bar
- plt.plot
- plt.scatter
- plt.hist
Answer: plt.hist. plt.hist bins values and draws a histogram, ideal for visualizing how data is distributed.
What does fig, ax = plt.subplots() return?
- A figure and an axes (or array of axes)
- Two figures
- An axes and a legend
- Two axes only
Answer: A figure and an axes (or array of axes). plt.subplots() returns a Figure and one or more Axes objects, the basis of the object-oriented API.
In the object-oriented API, how do you set the title on an axes named ax?
- plt.set_title('T')
- ax.set_title('T')
- ax.title('T')
- fig.title('T')
Answer: ax.set_title('T'). On an Axes object you call ax.set_title(); the pyplot equivalent is plt.title().
Which call makes labels passed via the label= argument appear on the plot?
- plt.show()
- plt.grid()
- plt.label()
- plt.legend()
Answer: plt.legend(). plt.legend() (or ax.legend()) collects the label= values from plotted artists into a legend box.
How do you save a figure to a PNG file?
- fig.download('chart.png')
- plt.export('chart.png')
- plt.savefig('chart.png')
- plt.write('chart.png')
Answer: plt.savefig('chart.png'). plt.savefig('chart.png') (or fig.savefig) writes the current figure to disk; the format follows the extension.
What is the difference between the pyplot interface and the object-oriented API?
- They produce different file formats
- pyplot uses an implicit 'current' figure/axes state machine, while the OO API uses explicit fig/ax objects
- pyplot is faster at rendering
- Only the OO API can draw bars
Answer: pyplot uses an implicit 'current' figure/axes state machine, while the OO API uses explicit fig/ax objects. pyplot tracks an implicit current figure/axes; the OO API gives you explicit Figure and Axes objects, preferred for complex or multi-panel plots.
Which argument to plt.subplots creates a 2-by-2 grid of axes?
- nrows=2, ncols=2
- shape=4
- grid=(2, 2)
- rows=2, cols=2 only
Answer: nrows=2, ncols=2. plt.subplots(nrows=2, ncols=2) returns the figure and a 2x2 array of Axes you can index.
Continue this course
- Previous: NumPy for Numerical Computing
- Next: Building APIs with FastAPI — Typed path operations, Pydantic models, dependency injection and auto Swagger docs
- Quick reference: Python cheat sheet