Plotting with DataFrame.plot()
Reviewed & published by Brayan K
DataFrame.plot() is the built-in charting method that turns a Series or DataFrame straight into a Matplotlib figure — line, bar, histogram, scatter, or box — without leaving pandas.
Part of the free Pandas course at LearnCodingFast — hands-on lessons with examples you run in your browser, plus practice exercises and a quick quiz.
You will choose chart types with kind=, plot the output of value_counts and groupby, add titles and axis labels, and understand that Matplotlib does the drawing underneath.
What You'll Learn in This Lesson
- Pick a chart with kind= line / bar / hist / scatter / box
- Plot a Series or a whole DataFrame
- Chart value_counts() and groupby() results
- Add a title and axis labels inline
- Know that Matplotlib powers it underneath
- Set x and y for a scatter plot
1 The .plot() Method and kind=
Every Series and DataFrame has a .plot() method. With no arguments it draws a line chart using the index as the x-axis. Switch the chart with kind=: "line", "bar", "hist", "scatter", or "box". Under the hood, pandas hands everything to Matplotlib.
import pandas as pd
import matplotlib
matplotlib.use("Agg")   # draw without a screen

df = pd.DataFrame({"month": [1, 2, 3], "sales": [10, 14, 9]})

ax = df.plot(x="month", y="sales", kind="line", title="Monthly Sales")
# ax is a Matplotlib Axes object you can keep tweaking
import pandas as pd
import matplotlib
matplotlib.use("Agg") # headless backend, no window needed
df = pd.DataFrame({"month": [1, 2, 3, 4],
"sales": [10, 14, 9, 18]})
ax = df.plot(x="month", y="sales", kind="line", title="Monthly Sales")
# Confirm the chart was built and inspect the underlying data
print(type(ax).__name__)
print(df["sales"].describe()[["min", "max", "mean"]])
# ✅ Expected output:
# Axes
# min 9.00
# max 18.00
# mean 12.75
# Name: sales, dtype: float64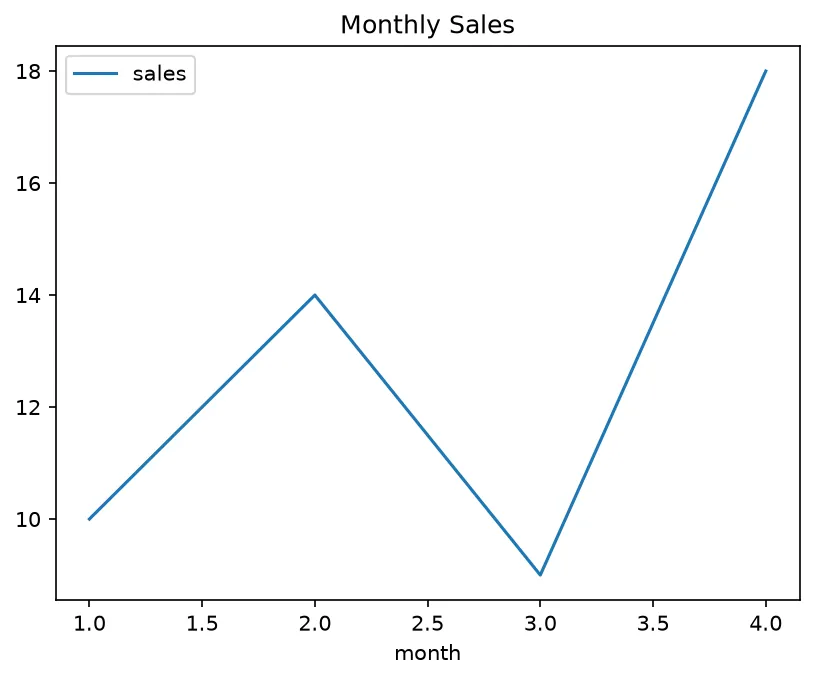
2 Bar Charts from value_counts & groupby
The most common quick chart is a bar of category counts. Because value_counts() returns a Series, you can chain .plot(kind="bar") right onto it. The same trick works after a groupby aggregation — the grouped result is a Series whose index becomes the bar labels.
# bar of category frequencies
df["city"].value_counts().plot(kind="bar", title="Rows per city")

# bar of summed sales per region
df.groupby("region")["sales"].sum().plot(kind="bar")
import pandas as pd
import matplotlib
matplotlib.use("Agg")
df = pd.DataFrame({"city": ["NYC", "LA", "NYC", "SF", "LA", "NYC"]})
counts = df["city"].value_counts()
ax = counts.plot(kind="bar", title="Rows per City")
# The chart is built from these counts:
print(counts)
# ✅ Expected output:
# city
# NYC 3
# LA 2
# SF 1
# Name: count, dtype: int64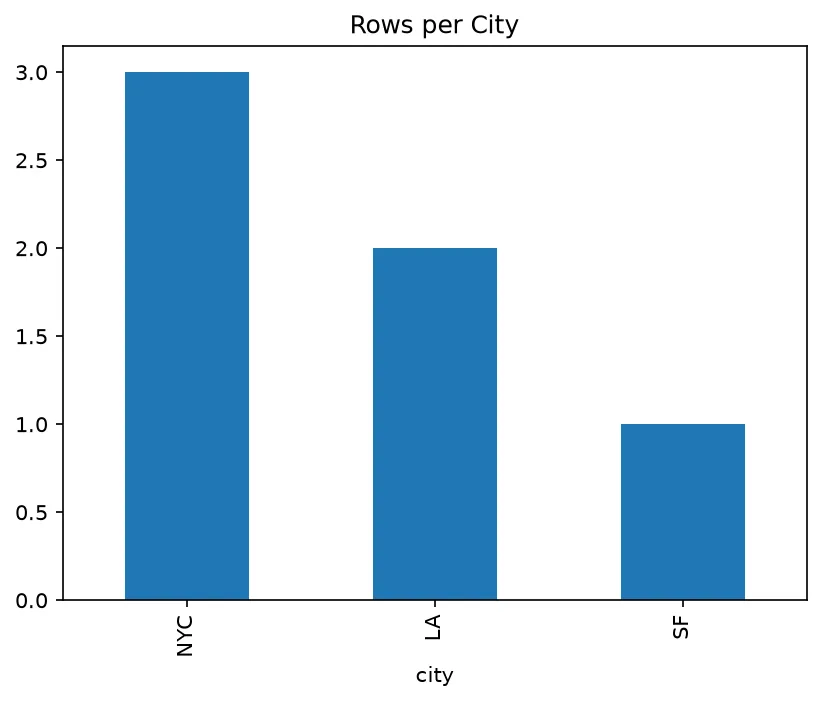
3 Histograms, Scatters & Axis Labels
Use kind="hist" to see the distribution of one numeric column, kind="scatter" with x= and y= to compare two columns, and kind="box" for spread and outliers. Most chart types accept title=, xlabel=, and ylabel= directly.
df["age"].plot(kind="hist", bins=10, title="Age distribution")

df.plot(kind="scatter", x="height", y="weight",
        xlabel="Height (cm)", ylabel="Weight (kg)")

df["score"].plot(kind="box")   # median, quartiles, outliers
import pandas as pd
import matplotlib
matplotlib.use("Agg")
df = pd.DataFrame({
"height": [150, 160, 170, 180, 190],
"weight": [50, 60, 65, 80, 90],
})
ax = df.plot(kind="scatter", x="height", y="weight",
title="Height vs Weight",
xlabel="Height (cm)", ylabel="Weight (kg)")
print(ax.get_title())
print(ax.get_xlabel(), "/", ax.get_ylabel())
# ✅ Expected output:
# Height vs Weight
# Height (cm) / Weight (kg)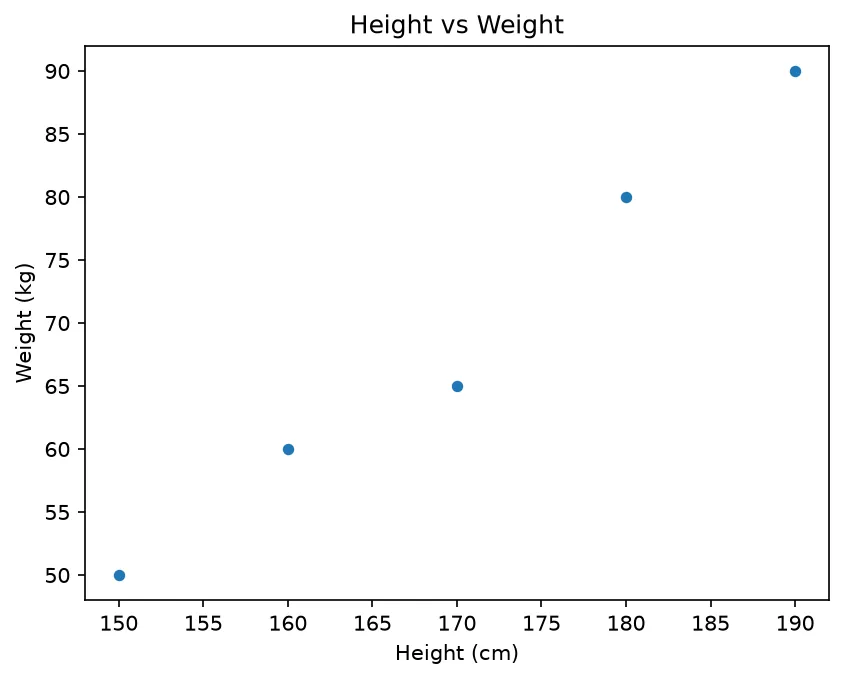
import pandas as pd
import matplotlib
matplotlib.use("Agg")

df = pd.DataFrame({"region": ["N", "S", "N", "E", "S", "N"],
                   "sales":  [10, 20, 30, 5, 15, 25]})

# 🎯 YOUR TURN:
# Make a BAR chart of total sales per region.
# Replace ___ with the chart kind for vertical bars.

totals = df.groupby("region")["sales"].sum()
ax = totals.plot(kind="___", title="Sales by Region")

print(totals)
# Expected output:
# region
# E     5
# N    65
# S    35
# Name: sales, dtype: int64
! Common Errors (And How to Fix Them)
❌ Scatter without x and y
A scatter needs both axes named:
df.plot(kind="scatter") # ❌ ValueError: scatter requires x and y✅ Fix: name the two columns:
df.plot(kind="scatter", x="height", y="weight") # ✅❌ Plotting text columns as a line
df["city"].plot(kind="line") # ❌ cannot draw a line of strings✅ Fix: count first, then use a bar:
df["city"].value_counts().plot(kind="bar") # ✅🎯 Mini Challenge: Chart a Sales Table
Build two charts from one DataFrame and confirm the data behind them.
- A line chart of sales over day with a title
- A bar chart of total sales per product
- Print the grouped totals so the output is visible
import pandas as pd
import matplotlib
matplotlib.use("Agg")

df = pd.DataFrame({
    "day":     [1, 2, 3, 4],
    "product": ["A", "B", "A", "B"],
    "sales":   [10, 20, 15, 25],
})

# 1) line chart of sales over time
df.plot(x="day", y="sales", kind="line", title="Sales Over Time")

# 2) bar chart of totals per product
totals = df.groupby("product")["sales"].sum()
totals.plot(kind="bar", title="Sales by Product")

print(totals)

# ✅ Expected output:
# product
# A    25
# B    45
# Name: sales, dtype: int64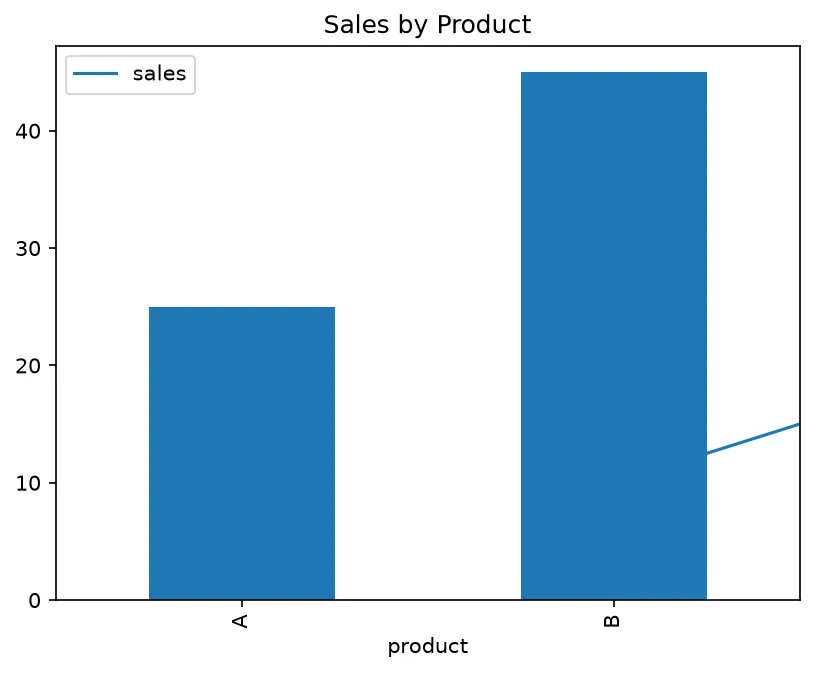
❓ Frequently Asked Questions
Lesson complete — your data can speak in pictures!
You can pick a chart with kind=, plot the result of value_counts and groupby, label axes inline, and you know Matplotlib is doing the drawing under .plot().
Practice quiz
Which library does DataFrame.plot() use under the hood?
- Plotly
- Matplotlib
- Seaborn
- Bokeh
Answer: Matplotlib. pandas plotting is a thin wrapper around Matplotlib.
What chart kind does .plot() draw with no arguments?
- bar
- scatter
- line
- hist
Answer: line. The default kind is 'line', using the index as the x-axis.
Which argument chooses the chart type?
- type=
- chart=
- style=
- kind=
Answer: kind=. Pass kind='line'/'bar'/'hist'/'scatter'/'box' to pick the chart.
What kind draws vertical bars for category totals?
- 'bar'
- 'line'
- 'box'
- 'hist'
Answer: 'bar'. kind='bar' draws vertical bars; great after groupby or value_counts.
Why must a scatter plot specify x and y?
- To set the title
- It compares two specific columns and can't guess them
- To enable color
- Scatter is always sorted
Answer: It compares two specific columns and can't guess them. A scatter needs both axes named because it relates two chosen columns.
What object does .plot() return?
- A DataFrame
- A Matplotlib Axes you can keep customising
- None
- A Series
Answer: A Matplotlib Axes you can keep customising. .plot() returns a Matplotlib Axes, so you can tweak labels, limits, and legend afterwards.
How do you chart category frequencies as bars in one line?
- df.plot(kind='hist')
- df.sort_values().plot()
- df.describe().plot()
- df['city'].value_counts().plot(kind='bar')
Answer: df['city'].value_counts().plot(kind='bar'). value_counts() returns a Series, so .plot(kind='bar') charts it directly.
Which kind shows the distribution of a single numeric column?
- 'hist'
- 'scatter'
- 'line'
- 'bar'
Answer: 'hist'. kind='hist' bins one column to reveal its distribution.
By default, value_counts() sorts bars how?
- Alphabetically
- By frequency (tallest first)
- Randomly
- By index
Answer: By frequency (tallest first). value_counts sorts by count, so add .sort_index() for label order.
Which kind is best for spread and outliers?
- 'line'
- 'scatter'
- 'box'
- 'bar'
Answer: 'box'. kind='box' shows median, quartiles, and outliers.
Continue this course
- Previous: Time Series Ops: shift, diff & pct_change
- Next: Method Chaining & .pipe() — Write clean, readable pipelines with chaining, assign, and pipe
- Quick reference: Pandas cheat sheet
Frequently asked questions
What library does DataFrame.plot() actually use?
By default pandas plotting is a thin wrapper around Matplotlib. Every .plot() call builds a Matplotlib figure under the hood, which is why you can pass familiar arguments like title, xlabel, and figsize, and why plt.show() displays the result.
How do I choose the chart type?
Pass kind= to .plot(): 'line' (default) for trends over time, 'bar' for category comparisons, 'hist' for distributions, 'scatter' for relationships between two columns, and 'box' for spread and outliers. There are also convenience methods like df.plot.bar() and df.plot.hist().
Why does my scatter plot need x and y arguments?
A scatter compares two specific columns, so you must tell pandas which one is the horizontal axis and which is the vertical: df.plot(kind='scatter', x='height', y='weight'). Line and bar plots can use the index automatically, but scatter cannot guess.
Can I plot the result of value_counts or groupby directly?
Yes — both return a Series or DataFrame, and Series and DataFrames have a .plot() method. df['city'].value_counts().plot(kind='bar') and df.groupby('region')['sales'].sum().plot(kind='bar') are extremely common one-liners.